
| CONTENTS | GLOSSARY | SUBJECT INDEX | SEARCH DOCUMENTATION |
Various quantities associated with the radiation flux can be displayed as a function of time. These are tracked at the inner and outer boundaries of the spatial grid, and at spatial region boundaries.
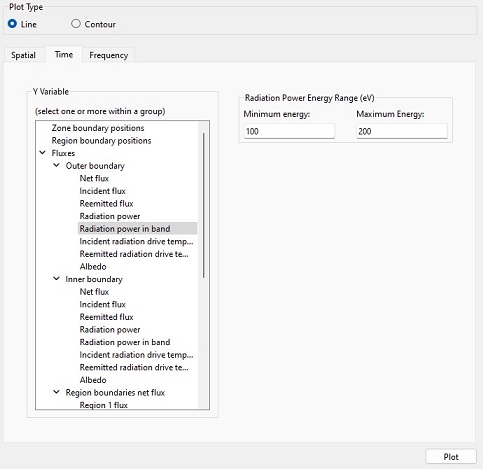
When selecting the Flux quantity to plot, multiple selections can be made within each group of fluxes.
All quantities are frequency-integrated across the entire spectrum, except for the Radiation power in band item. In this case, the minimum and maximum values of the photon energy band range are specified.
| Copyright © 2002-2025 Prism Computational Sciences, Inc. | HELIOS 11.0.0 |