
Axes Settings
The axes settings can be changed on the Axis Properties dialog. To access the
dialog either:
- Select the menu item Axes | Properties from the menu bar or from the menus
shown on right-clicking on a graph.
- Click on the axes toolbar button:

- For 2D plots, double click on an axis.
On the 'Axis Settings' tab, the axis type, visibility, title, scaling, and limits can all be set:
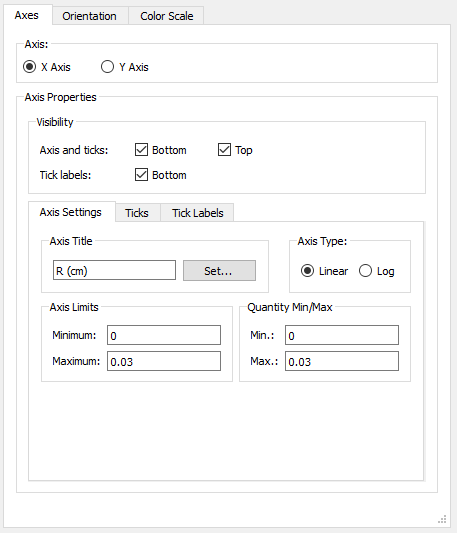
Notes:
- If the axis scaling is set to log users will need to provide an non-zero positive minimum.
On the 'Ticks' tab, the tick spacing, the number
of minor ticks and the appearance of the ticks can be set:
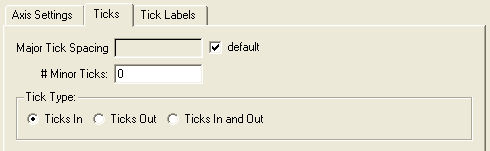
Notes:
- If the major tick spacing will give either an excessive number of ticks
or less than two ticks, the spacing value will be overridden.
- The maximum number of minor ticks is 9.
- Major tick spacing will update automatically such that there are always at least two major ticks or no more than ten major ticks at once for a given axis.
On the 'Tick Labels' tab the tick label font and
style can be set:
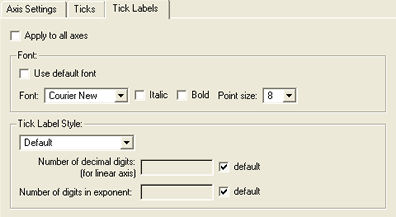
Notes:
- By checking the 'Apply to all axes' box, the font and tick label style can
be set the same for all the axes.
- The choices for the tick label style are:
- Default: the plot library will choose either decimal or scientific style,
depending on the data values.
- Decimal: e.g. 12345.678
- Scientific e.g. 1.2345e4
- Engineering e.g. 12.345e3 (the exponent will be in multiples of 3).
| Copyright
© 2000-2023 Prism Computational Sciences, Inc. |
PrismPLOT
|