
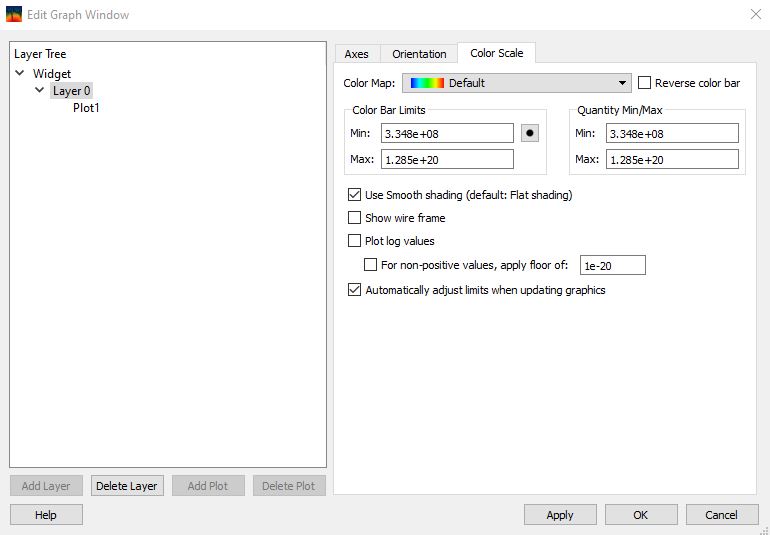
Contour Plot Properties
The Contour Plot Properties dialog is used to set the colors, data range and
plotting syles for a contour plot. To access the dialog either:
- Select the plot item from the Graphics Layer Controller
- Double click on a contour plot.
Notes:
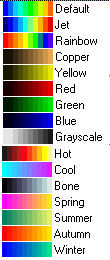
- The currently available color bars are:
- The color bar can be reversed by checking the 'Reverse color bar' box.
- The minimum and maximum data values are shown below the color bar limits.
The 'Defaults' button will set the color bar limits to the actual data extremes.
- The plot limits for the data can be applied to all future contour plots
in the layer by checking the Apply these limits to future plots box.
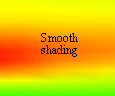
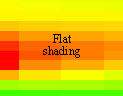
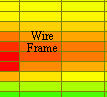
- Examples of Smooth shading, Flat shading and
a Wire Frame:
| Copyright
© 2000-2023 Prism Computational Sciences, Inc. |
PrismPLOT
|