
| CONTENTS | GLOSSARY | SEARCH DOCUMENTATION |
To view equation of state quantities, either press the EOS button on the left side of the main window or select the Display | EOS Data menu item.
The quantities available for plotting are listed in the Plot combo box. The contents of the combo box depend on the data available. (Therefore, it will also depend on the version number of PROPACEOS used for the calculation).
The type of plot to be displayed depends on the number of independent variables (IVs) selected.
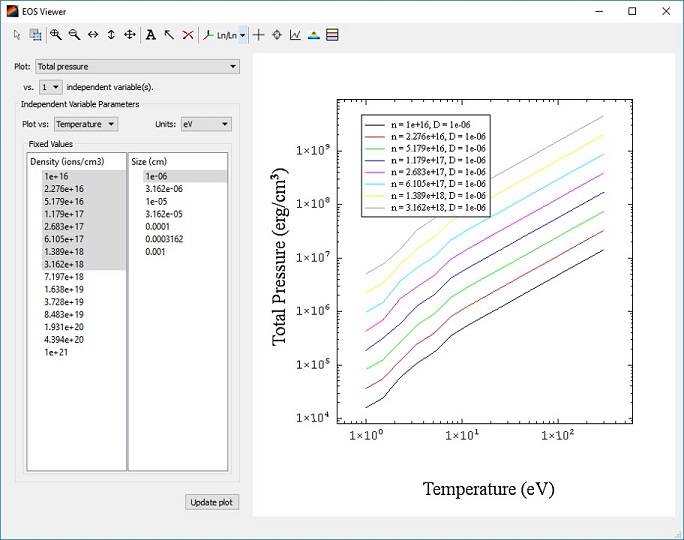
When ploting against one independent variable, line plots are generated. Select the variable to be plotted against in the Plot vs. combo box. The values for other IVs remain fixed for a given line plot.
The values of the fixed IVs are listed in the Fixed Values box. For each selected fixed value combination, one line plot is generated. In the example below, 8 line plots are generated (8 fixed density values and 1 fixed size value).
Click on the Update Plot button to display the plot.
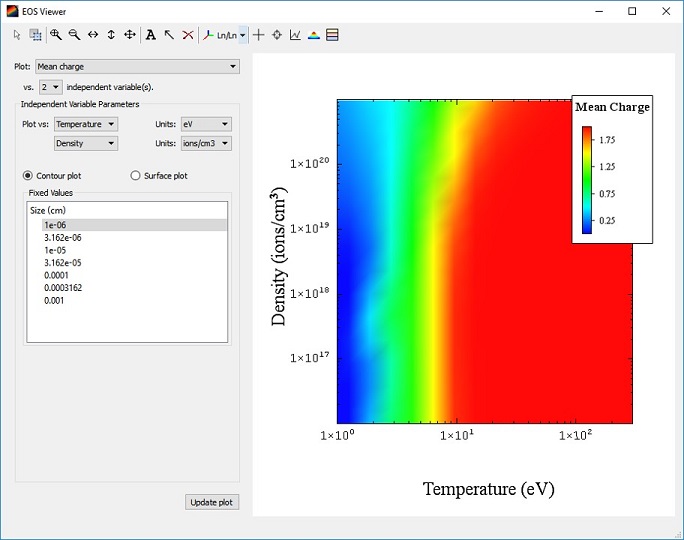
When plotting against two independent variables, either a contour plot or a surface plot can be generated. Select the variables to be plotted against in the Plot vs. combo boxes.
The values for other IVs (if more than two are used in the PROPACEOS run) remain fixed. These values are listed in the Fixed Values box. Only one fixed value can be selected from each fixed value box.
When ploting against three independent variables, either a contour slice or an isosurface plot can be generated. Select the variables to be plotted against in the Plot vs. combo boxes. The values for other IVs (if more than three are used in the PROPACEOS run) remain fixed.
If the plot quantity selected is one of the "Opacity for Group" items, a box showing the available photon energy groups is displayed. Select the photon energy group for which the opacity data is to be plotted.
| Copyright © 2024 Prism Computational Sciences, Inc. | PROPACEOS 10.0.0 |