
| CONTENTS | GLOSSARY | SEARCH DOCUMENTATION |
To view frequency-dependent opacities, either press the Opacities button on the left side of the Main Window or select the Display | Opacities menu item.
For each set of indepedent variables (e.g., temperature and density), three types of group mean opacities can be displayed:
For LTE plasmas, the Planck absorption and emission opacities are identical (because of Kirchhoff's law).
When initially displayed, data corresponding to one T-ρ point is shown. Additional data can be shown in the plot by utilizing the Add button. Data can be removed from the graph using the Delete button.
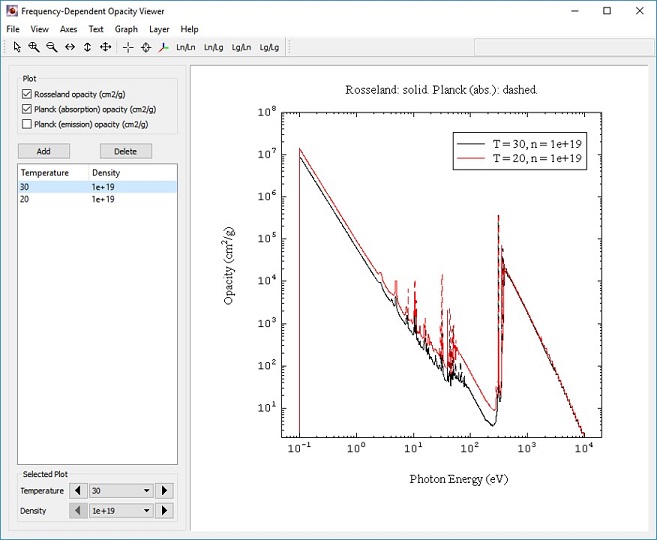
The different types of opacities are, by default, represented by different line stipplings:
Attributes for each of the line plots can be modified by right-clicking in the plot frame, and selecting Graph | Line Properties. The legends can be edited by double clicking on them or by right-clicking and selecting Open Properties. See Editing Legends for details.
The T-ρ values of any one of the items listed in the left box can be adjusted using the combo boxes or arrow buttons at the lower left of the window. This allows users to easily select data for any T-ρ point, and to compare data of different T-ρ points.
| Copyright © 2024 Prism Computational Sciences, Inc. | PROPACEOS 10.0.0 |