
| CONTENTS | ||
The data for a plot can be viewed or saved to a *.dat file.
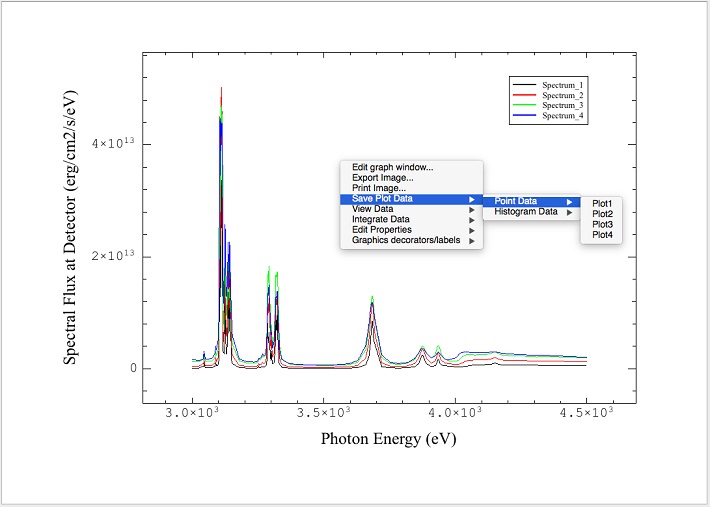
To save the data of a given plot, right click on said plot and go to Save Plot Data and choose either Point or Histogram Data for line plots, or Node and Zone Data for contour plots.
For line plots, point data is the the data at each point of the line plot, and histogram data is the data of the histogram boundaries (as in lineouts). For contour plots node data is the data at each polygon node and zone data is the data at the centroid of each polygon.
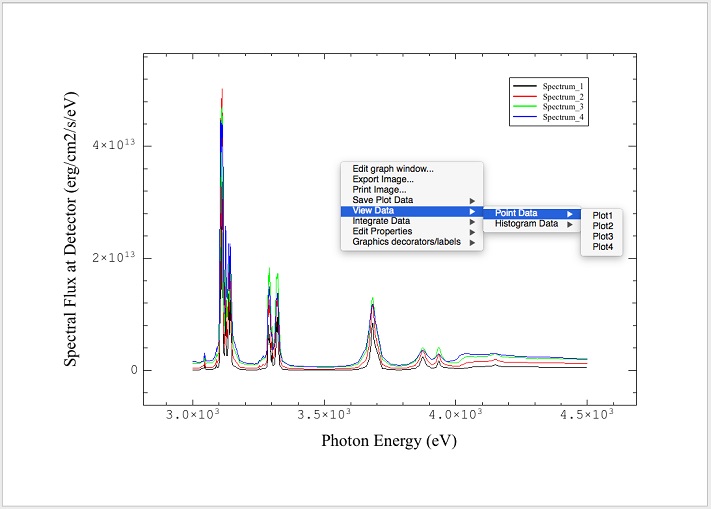
To view the data in a table viewer, right click on the plot and go to view data:
Note that due to irregular binning save and view data is disabled for some plots (e.g., streaked spectra in SpectraPLOT).
| Copyright © 2000-2023 Prism Computational Sciences, Inc. | PrismPLOT |