
| CONTENTS | ||
Most plots in Prism applications provide a default legend where the visual attributes of the plot are shown along with a text description. There is also a mechanism of making a custom legend that could, for example, group plots by certain characteristics. This is best shown by example.
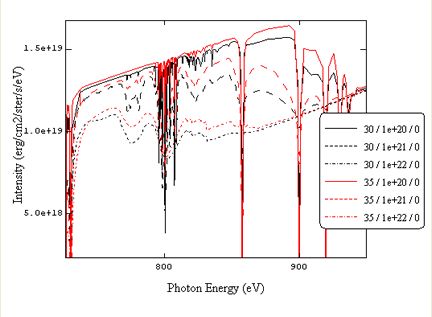
The figure below shows a plot from PrismSpect. The lines represent spectra at different temperatures and densities.
The legend uses a legend controller system to edit which plots appear in the legend. When the legend dialogue is opened in spectraPLOT a "Manage Plots" button is availible which brings update a layer tree based selection system.
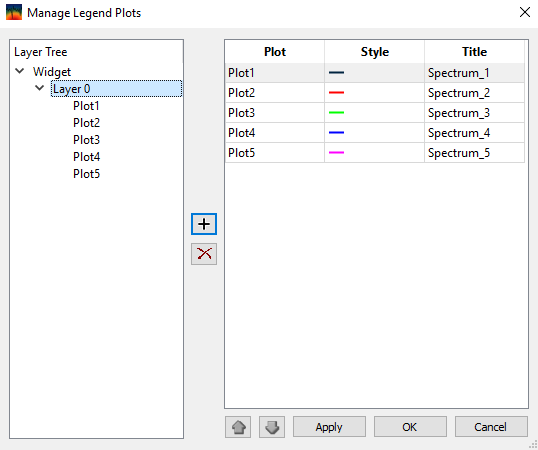
Users can select plots from the layer tree on the left, and add them to the legend but hitting the "+" icon. Users may also edit the order lots appear in the legend using the up and down arrows as well as editing their legend display name under the Title column. The style of each line can be edited using the style options in the center column.
| Copyright © 2000-2023 Prism Computational Sciences, Inc. | PrismPLOT |