Line Properties
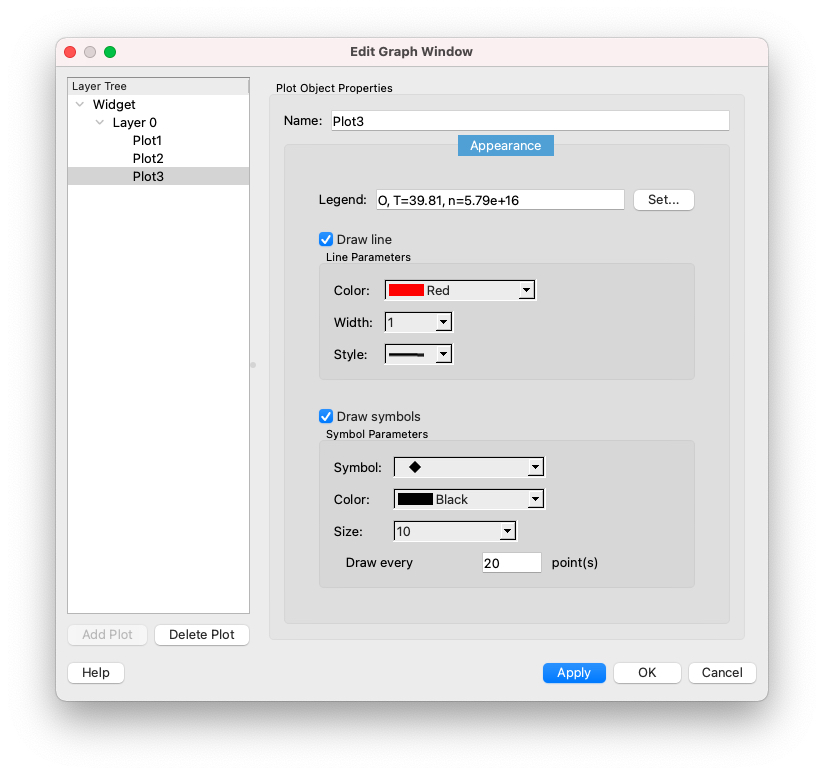
The Line Properties dialog is used to set the color, width, line style and
symbols for any displayed plot. To access the dialog either:
- Select the plot from the Graphics Layer Controller
- Double click on a line in a plot
Notes:
- If more than one plot is selected, the chosen properties will apply to the
selection. If a property is not initially shared, the combo boxes will show
'Undefined'.
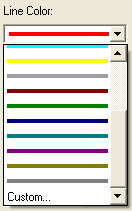
- Line color can be chosen from a set of pre-defined
colors or may be a custom color (last item in the combo box)
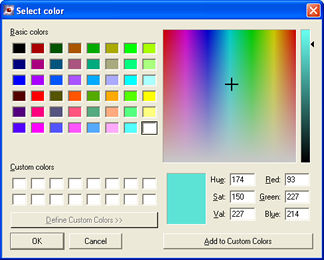
Clicking on custom displays the color picker:
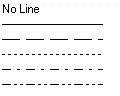
- The line styles currently available are:
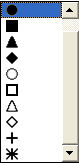
- The symbols available to show on a plot are
:
- To cut down crowding on a plot with many points, the number of data points
for which symbols are drawn can be reduced by using the 'Draw symbol every
n points' box.
| Copyright
© 2000-2023 Prism Computational Sciences, Inc. |
PrismPLOT
|