
| CONTENTS | GLOSSARY | SUBJECT INDEX | SEARCH DOCUMENTATION |
In SPECT3D, the detector defines the solid angle of the plasma which is contributing light in the simulation. It is divided into "pixels", input by the user, thus dividing that solid angle into resolved portions. The specific intensity (calculated along the line of sight (LOS) emanating from each pixel centroid) is assumed to be uniform across each pixel.
It is important not to confuse the dimensions of the SPECT3D detector with those of the physical detection region in an experiment. While the SPECT3D detector may be set up to resolve plasma regions which radiate differently, the entirety of a physical experimental detector may be sensitive to each emitting section of the plasma. Furthermore, your physical detector may in reality be much larger or much smaller than your SPECT3D detector. However, the position of the SPECT3D detector must agree with that of your physical detector, for the solid angle calculations to be correct.
Determining absolute power collected
A "Spectrum" plot type displays the spectral flux as defined by [1], which has units of erg/cmˆ2/s/eV. Thus, to determine an absolute power collected (i.e., to eliminate the 1/cmˆ2), you need to know the physical detection region which is sensitive any given point on the plasma's visible solid angle. More than likely, this region is simply your whole physical detector (i.e., your entire physical detector sees every part of your plasma as defined by your SPECT3D pixels).
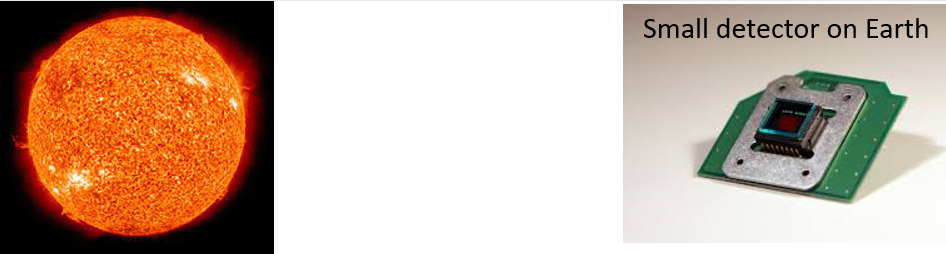
Example 1: Viewing the Entire Sun
A physical detector of area A observes the sun, an opaque sphere far away, over a given spectral range:
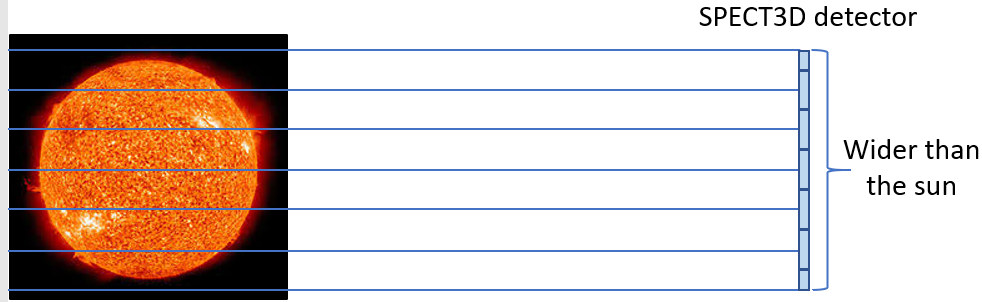
Since the whole sun is visible, we set up a SPECT3D detector which covers the whole solid angle of the sun (but is still at the position of your physical detector) :
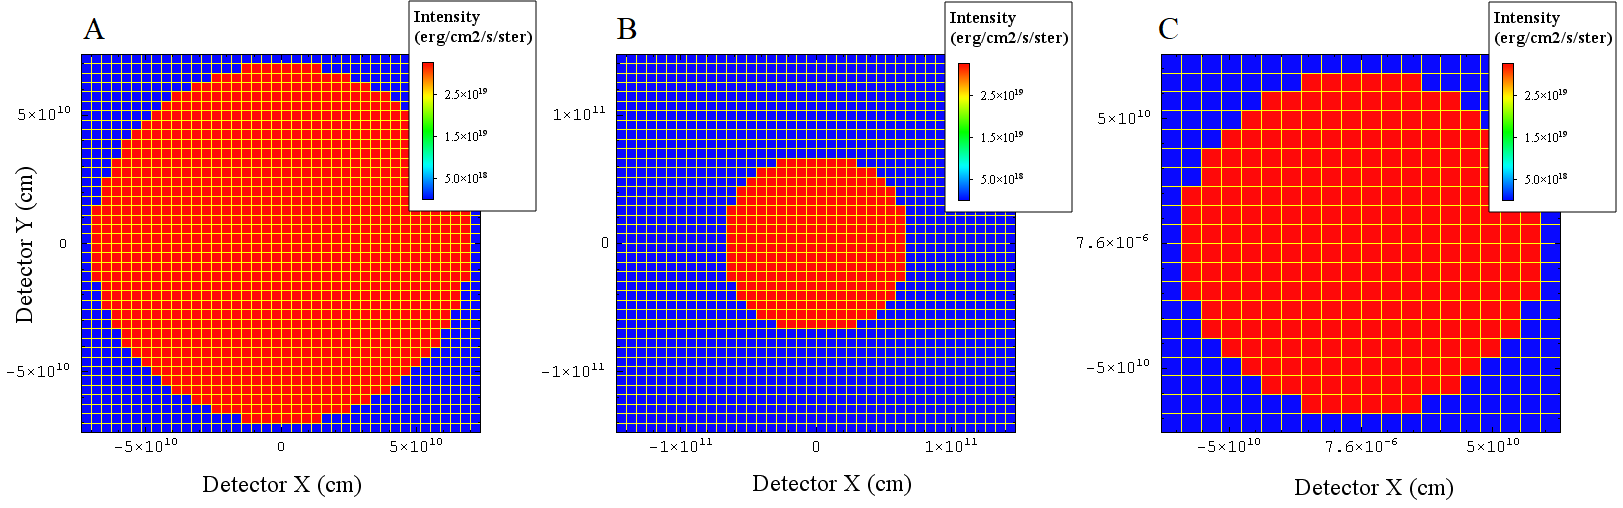
We receive an image (using more pixels than indicated in above image) which looks like this:
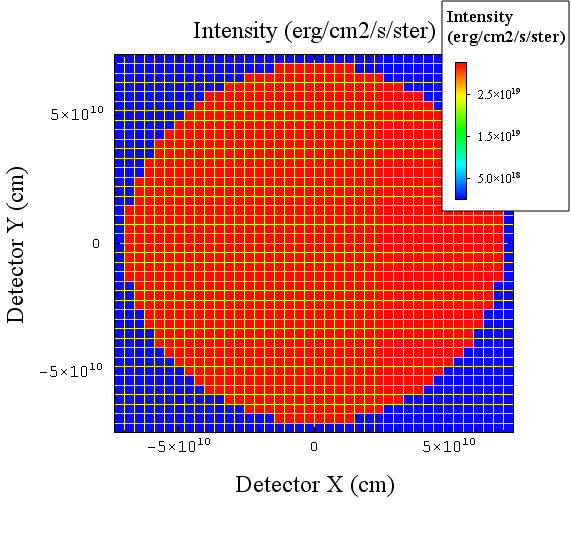
Each pixel displays the frequency-integrated specific intensity, exiting the plasma, calculated along a LOS at the center of the pixel. Here, we are saying that our entire physical detector is sensitive to each of these solid angle sections of the sun. Thus, the intensity calculated from each of these solid angle sections is covering our entire physical detector area. (Here it is important to consider the three approximations listed below, especially #1. In this scenario, most of our viewing angle of the sun is not parallel to the central axis, as each LOS calculation assumes. However, the further the detector is from the source, the better this approximation is.)
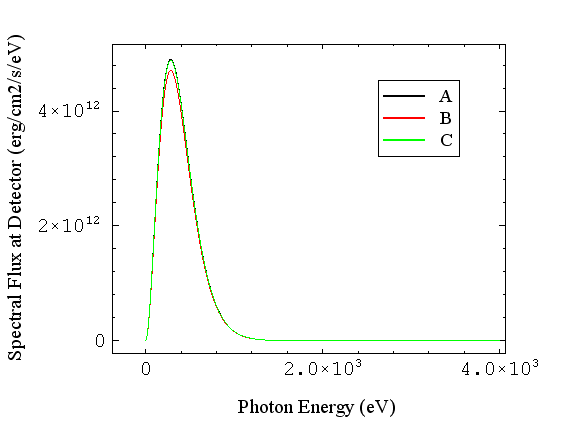
We can also plot a spectrum, which SPECT3D determines by multiplying each pixel's (frequency-resolved) specific intensity by its solid angle (again, the solid angle of the plasma subtended by the pixel), and summing over pixels, thus producing a total spectral flux (erg/cmˆ2/s/eV):
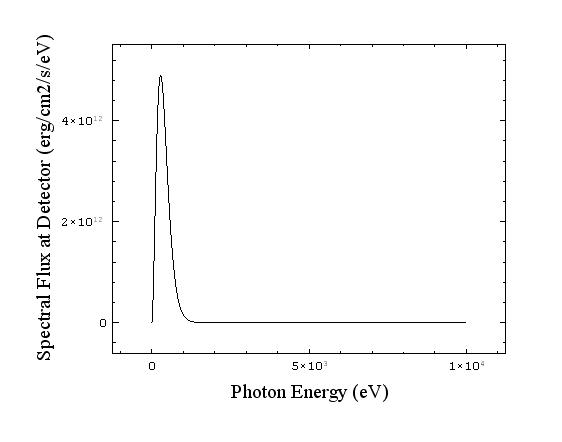
If we integrate this spectrum over frequency, we receive a total frequency-integrated flux (F) in units of erg/cmˆ2/s. This still has not incorporated the size of the physical detector. Thus, the final step in determining the total power (P) collected by the physical detector is to multiply by A (assuming constant sensitivity):
P = F x A (1)
All of the same arguments apply to the observation of a focused laser spot, where the physical detector is larger than the plasma, and the entire physical detector can see the entire plasma solid angle.
Notice that, in a case like this (entire source solid angle visible, and constant specific intensity), the spectral flux (and thus the absolute power) is independent of the size and density of the SPECT3D pixels used, and is also independent of the of the amount of dark area included around the source:
all produce the same spectral flux (though slight differences occur due to resolving a circular edge with rectangular pixels):
The density of SPECT3D pixels (LOSs) would thus be chosen based on the desired spatial resolution of the source's emission, balanced with computation time.
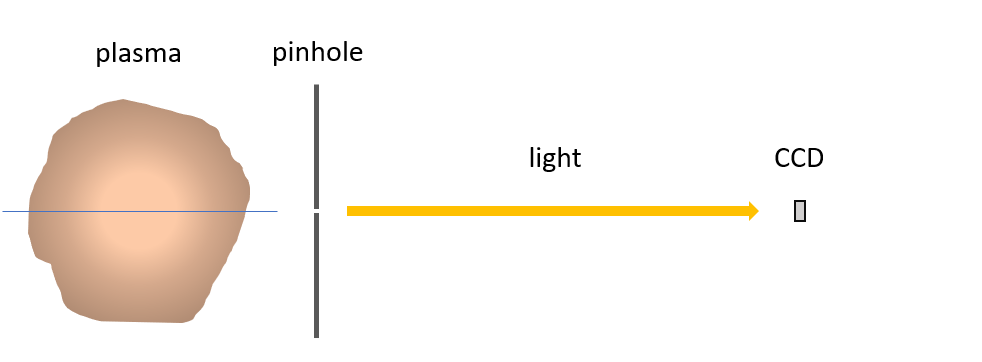
Example 2: Pinhole
When only part of a plasma's solid angle is visible, the size of the SPECT3D detector becomes crucial. In this example, a pinhole is placed in between a physical detector and a plasma, restricting the solid angle visible to the detector:
In such a case, we probably only need a single LOS (though further resolution can be done with more pixels, if the pinhole is large). We create a single "pixel" detector in SPECT3D, with the pixel size defining the solid angle of the plasma to which the experiment is sensitive (which would be calculated using the pinhole size and position). Again, we place the SPECT3D detector at the position of the physical detector, and receive a spectrum in erg/cmˆ2/s/eV. Integrating the spectrum over the frequency range gives F in Eq. 1. We then by the area (A) of the physical detector which is illuminated. We may encounter one of two scenarios:
(1) The light from the pinhole is well-collimated. In this case, the effective area is the same as the pinhole area.
(2) The light from the pinhole is not collimated, and the physical detector is illuminated at off-axis angles. If this is occurring, A should be the effective area illuminated, which may be the whole physical detector. However, we then need to consider Approximation #1 (below), since we have only simulated the on-axis LOS. This means that a detector further away will be better-simulated.
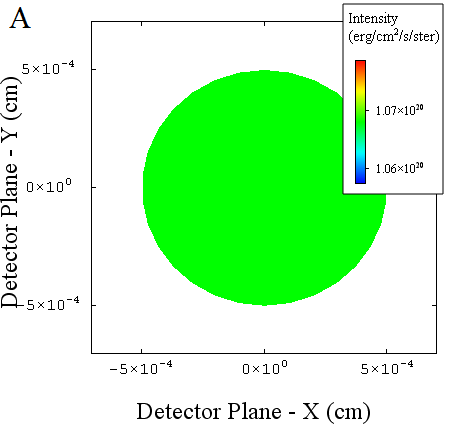
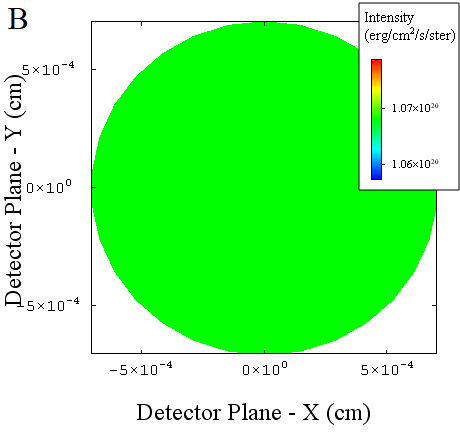
As mentioned above, the size of the SPECT3D detector is critical in this case. If we use a single-pixel disk detector, we receive an image like this:
If we double the area of the SPECT3D detector, we are in effect doubling the visible solid angle of the plasma. Though we receive an image with the same (frequency-integrated) specific intensity:
the spectral flux at our physical detector position (the detector position set in SPECT3D) is twice as high:
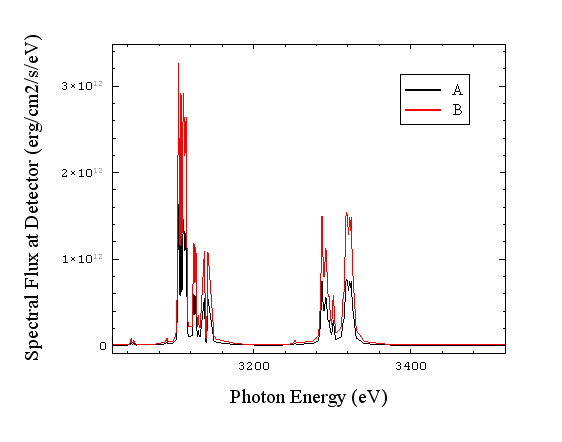
This is because the spectral flux is the integral of specific intensity over solid angle, which is twice as large. This is why the solid angle represented by the SPECT3D detector needs to be chosen as accurately as possible, based on what is known about the experimental geometry. This is still true in the case of higher resolution pixelation.
Note: if an increase in source solid angle (SPECT3D detector size) also corresponds to an increased experimental collection area (A in Eq. 1), the absolute power collected will increase by both factors. In the scenario where our light is collimated, and thus the collection area A is the same as the SPECT3D pixel area, if we double the source solid angle (defined by the SPECT3D detector size), we double the flux (e.g. spectrum B above), while also doubling the collection area A, resulting in 4x the power collected. Intuitively, this is because the doubling of the source solid angle corresponds to a doubled flux (which is per cmˆ2) over the entire collection region, which is also doubled.
Approximations:
1) The LOS rays, along which the line transport equation is solved, are drawn parallel, straight through the plasma, one for each SPECT3D detector pixel. Thus, there is an effective approximation for collection at angles off of this parallel (e.g., most of the detector in Example 1).
2) The solid angle subtended by each SPECT3D pixel is calculated as A/dˆ2, where A is the area of that SPECT3D pixel, and d is the distance between the SPECT3D detector and the Center of Projection, both defined by the user in the Detector tab of the SPECT3D interface. This is the solid angle used in determining the spectral flux from the specific intensity on each LOS.
3) The specific intensity (and flux) is assumed to be perpendicular to the detector surface. (This is related to (1).)
All of these assumptions mean that a detector far away (relative to the sizes of your plasma) will most accurately be represented by SPECT3D.
References:
[1] I. Hubeny and D. Mihalas, Theory of Stellar Atmospheres, pg. 72. Princeton University Press (2015).
| Copyright © 2024 Prism Computational Sciences, Inc. | SPECT3D 20.5.0 |