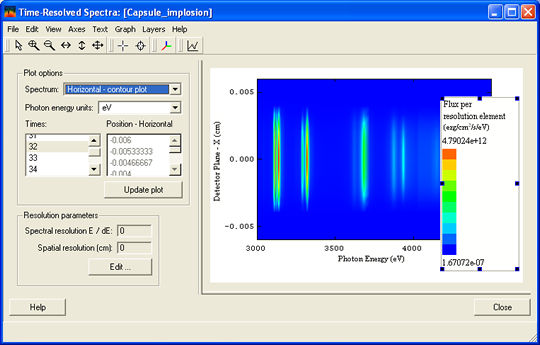

If spatially resolved spectra were produced in the simulation, the Plot options combo box will contain options to display either a contour plot showing the distribution of intensity across the detector pixels, or line plots for selected pixel values.
For a contour plot, select the Horizontal(Vertical) - contour plot option with one time selected. If more than one time is selected, the plot will be shown for the topmost selected time.
For convenience, a list of the pixel positions on the detector is shown.
To view line plots at selected pixels, choose the Horizontal(Vertical) - selected pixels option. Select the desired time steps in the Times list and the desired pixel values in the Position - Horizontal(Vertical) list. The spectra will display after clicking on the Update plot button.
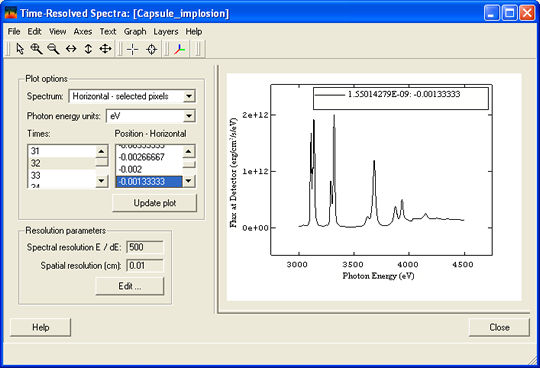
By default, the flux is plotted against photon energy in eV. The units can be changed by changing the setting in the Photon Energy Units combo box and clicking on the Update plot button..
For 1-D space-resolved spectra, the flux at the detector is shown in units of erg/cm2/s/eV per resolution element (or pixel). For an overview of how the flux at the detector is computed, see Appendix on SPECT3D Detector Fluxes.
The current spectral resolution and spatial reolutions are shown in the Resolution parameters frame. The values can be changed by clicking on the Edit... button. See Spectral and Image Resolution. The spectrum will be convolved with a Gaussian of width E/ΔE, and spatially convolved with a Gaussian with a width equal to the value of the spatial resolution.
The transitions and the spectral band details are not available for the contour plot.
For information on how to modify the plot parameters or save images or data from the graph, see the PrismPLOT Users Guide.
| Copyright © 2024 Prism Computational Sciences, Inc. | VISUALIZER 20.5.0 |