
Example: Argon Doped Implosion
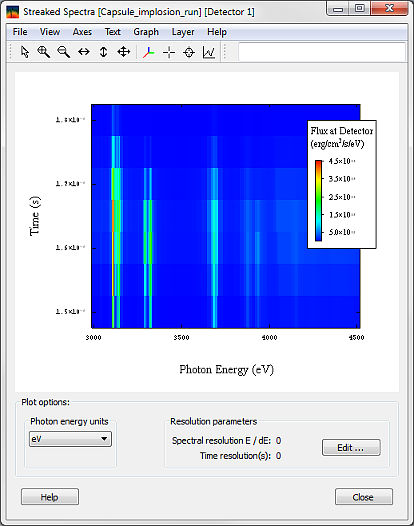
Displaying streaked spectra
To display streaked spectra, in the Visualizer main window:
- Select all simulation times (click on the first time index 31, then shift-click on
the last time index 37).
- Click the Streaked spectra button. The Streaked spectra window
opens.
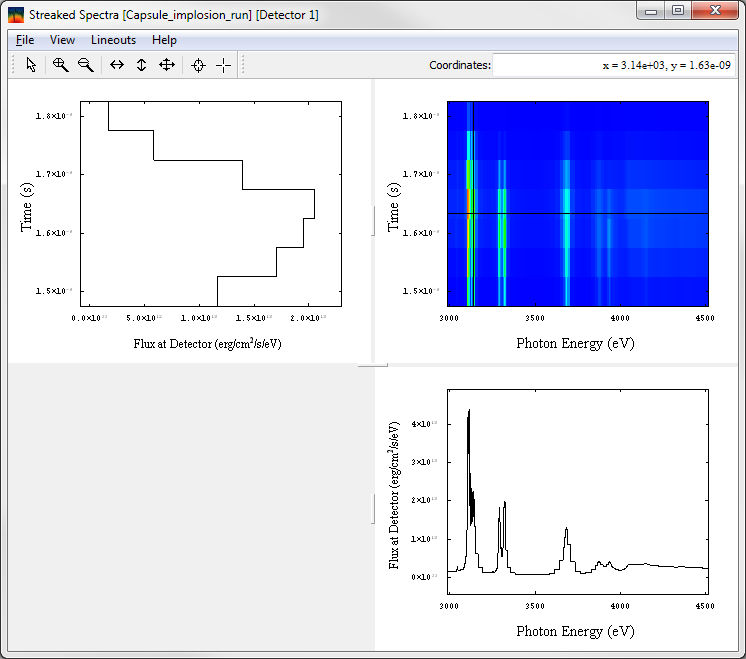
To study the details of the intensity evolution with time at a particular photon
energy and instantaneous spectra (vertical and horizontal lineouts respectively):
- Click on the Lineout tool button (on the right side of the toolbar).
A new window will open.
- Select with the mouse a point of interest on the image in the new window
and click.
Next
| Copyright
© 2024 Prism Computational Sciences, Inc. |
SPECT3D 20.5.0 |