
Example: Radjet
Using drill-down
Drill-down is a powerful feature that displays plasma and radiation properties
along a line of sight. In this example we display ionization
fractions of aluminum.
- In the Visualizer main window select time index 238 and click the Drilldown button. It opens the
drilldown window.
- Double click on the orange colored pixel of the image as shown in the figure below. The line of sight is automatically
selected and shown on the right. Note: you can also select X = 8 and Y = 2 in the Detector pixel window to choose the line of sight index 13.
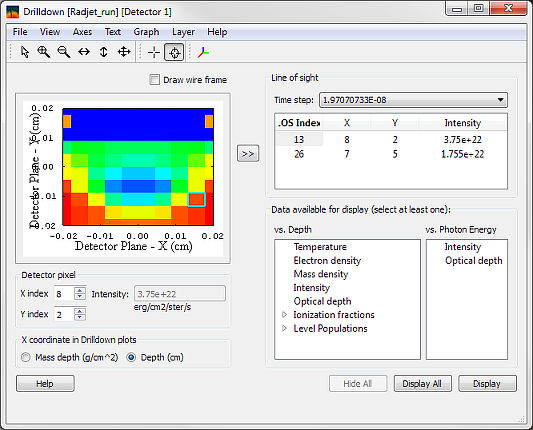
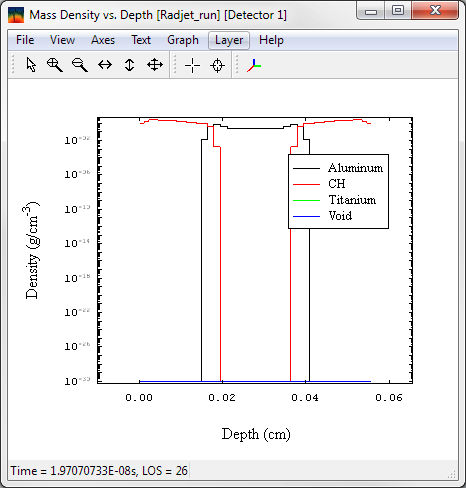
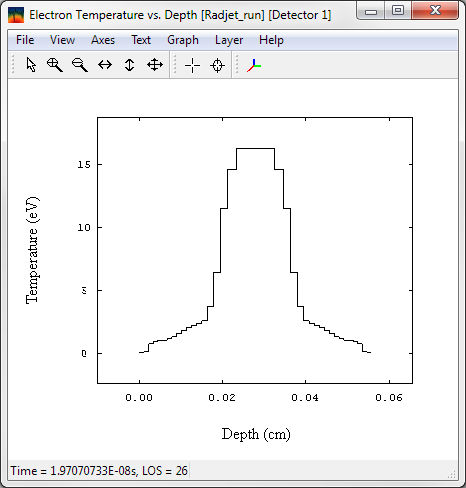
- In the Data Available for display field, select Mass density, Temperature and Optical depth.
- Click the Display button.
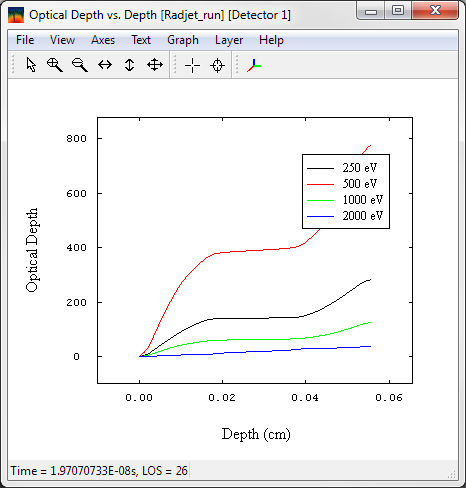
- To select the line of sight index 26, change Detector pixels to X=7, Y=5. The graphs shown below will be displayed. The optical depth plot shows the
variation of optical depth for the additional photon energies.
-
-
Next
| Copyright
© 2024 Prism Computational Sciences, Inc. |
VISUALIZER 20.5.0 |