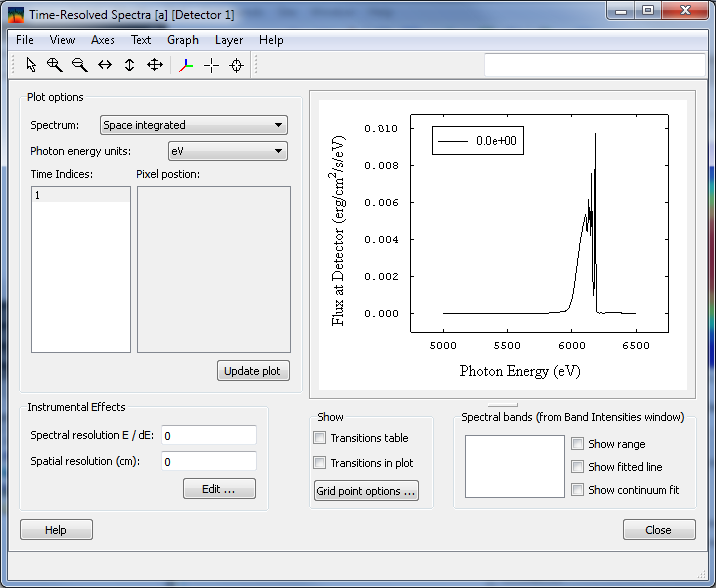

To display time resolved images, select a simulation time (in this example 1), and click the Time-Resolved Spectra button.
To view space-resolved spectrum:
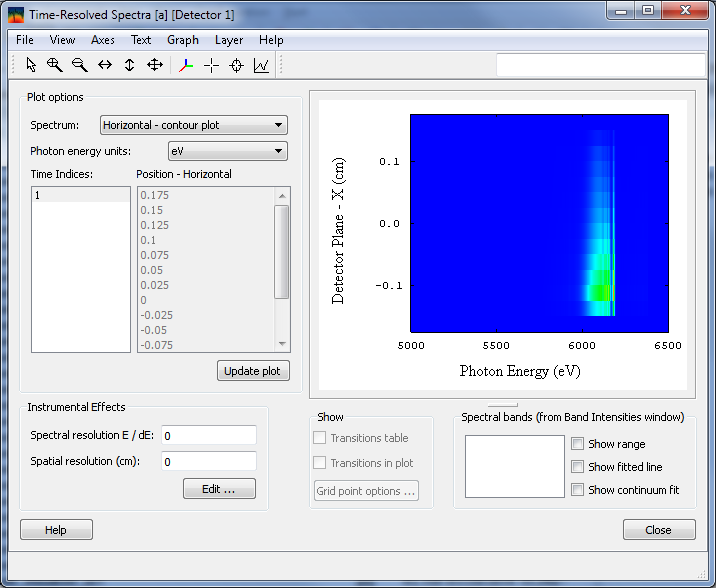
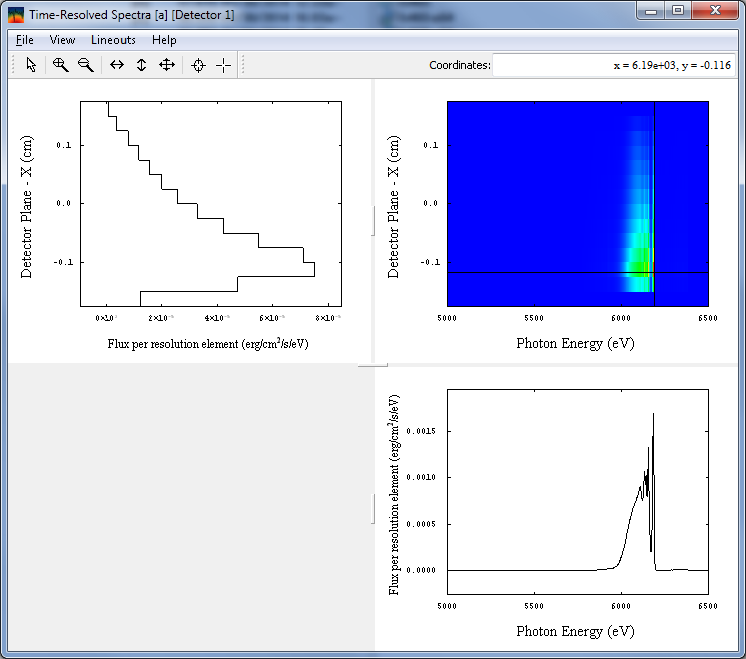
The purpose of the simulation is to illustrate the newly developed models for x-ray scattering diagnostics in realistic geometries. Figure below demonstrates a spatially resolved spectrum and lineouts along photon energy and position axes. The scattered signal from the sample decreases with distance from the source due to both geometric dilution and attenuation.
To study details of spectral and spatial dependence of the scattered signal:
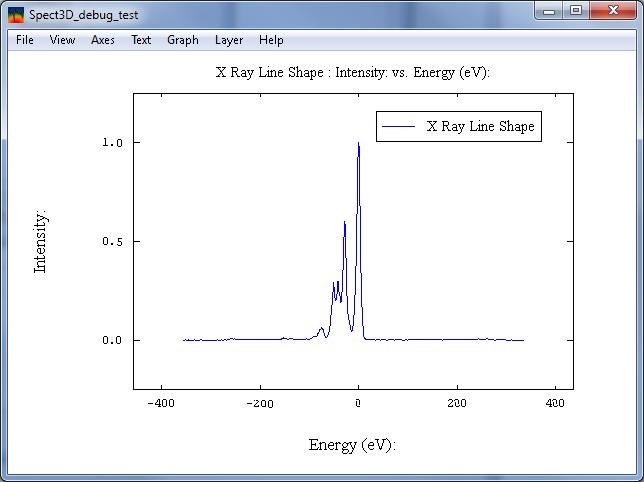
Note strong scattered feature around 6.1 keV; it is not present in the original source spectrum (given below for reference). To view this plot, in SPECT3D main window click on Backlighter -> X-ray Scattering Source Parameters -> Set Parameters. Click on Setup to view the tabulated data, highlight Intensity column and select Plot -> Table data from the menu. The figure shown below will be displayed.
| Copyright © 2024 Prism Computational Sciences, Inc. | VISUALIZER 20.5.0 |