Edit Data
All line plot data currently available in a graph are stored as datasets which
can be viewed and edited. To view the list of datasets:
- Select the menu item View | Data Sets. In the list,
the dataset name is followed by the name of the data used for the X variable
(this will often be the default name 'X'). Underneath each dataset name, the
names of the data available for the Y variable are shown.
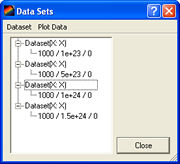
The Dataset menu (also available by right clicking on a dataset name) allows
the selected dataset to be viewed or deleted. The right click menu additionally
allows the dataset to be renamed.
Deleting a dataset will also delete any plots that use data from the dataset.
The name of a dataset and the name of the data contained within it can be edited
either by righ clicking on the name and selecting 'Rename' or by selecting the
name and clicking again (analagous to renaming a file in a directory).
To view the data, select View or double click on the dataset name. A table
of all the data will be shown.
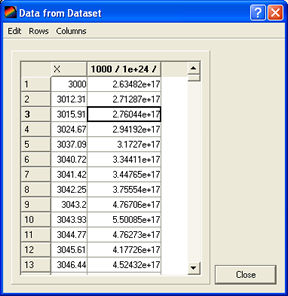
- To edit the data in an individual cell, double click on the cell and type
the changes. Tab or press the return key to enter the new value. If the data
is currently being plotted, the plot will change to reflect the new data.
- More extensive data editing can be achieved by using the Rows and Columns
menus (these menu items are also available by right clicking on a row or column
header):
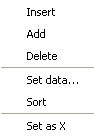
- Row menu:
- Insert: inserts empty rows at the position of the first selected
row. The number of rows inserted is equal to the number of rows selected.
- Add: adds an empty row to the end of the table.
- Delete: deletes the selected rows.
- Column menu:
- Insert: inserts empty columns at the postion of the first selected column.
The number of columns inserted is equal to the number of columns selected.
Available for column 2 and greater.
- Add: adds an empty column to the end of the table.
- Delete: deletes the selected columns. If any of the data columns are
being used in a plot, the plot will also be deleted.
- Set data...: enter a function to be used to produce
the data values:
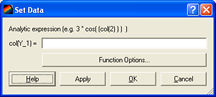
Data from other columns can be used as variables in the
expression by typing 'col(<column number>)'. For example, to have
a column of data that are the squares of the data in the first column,
type:
col(1) ^ 2
The predefined functions available are:
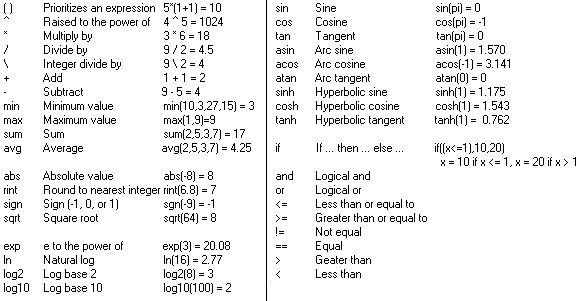
They can be seen by clicking on the 'Function Options' button.
- Sort: sorts the data into ascending order of the
first column (the X column).
- Set as X: sets the currently selected column to be the column used for
the x values in a plot.
| Copyright © 2000-2026
Prism Computational Sciences, Inc. |
VISRAD 21.1.1 |