| CONTENTS | GLOSSARY | SUBJECT INDEX | SEARCH DOCUMENTATION |
See also: Layer examples
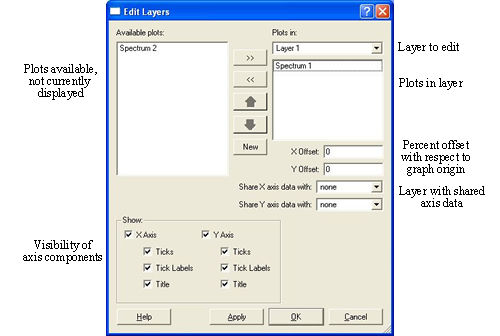
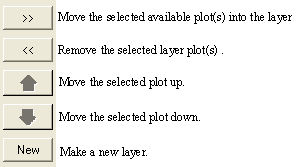
All visible plots are contained in a layer. To choose the plots to display in a layer, create new layers and change the display of the layer select the menu item Layers | Properties from the menu bar, from the menus shown by right clicking on the graph or by double clicking on the layer.
If there is a normal line graph, the following dialog appears:
Notes:
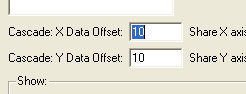
If there is a cascade, two controls are added:
The X and Y data offsets specify the offset of a plot from the previous plot as a percentage of the maximum data range. The maximum data range is the maximum data value from all the plots minus the minimum data value from all the plots.
| Copyright © 2000-2026 Prism Computational Sciences, Inc. | VISRAD 21.1.1 |