
Editing Legends
Most plots in Prism applications provide a default legend where the visual attributes of the plot are shown along with a text description. There is also a mechanism of making a custom legend that could, for example, group plots by certain characteristics. This is best shown by example.
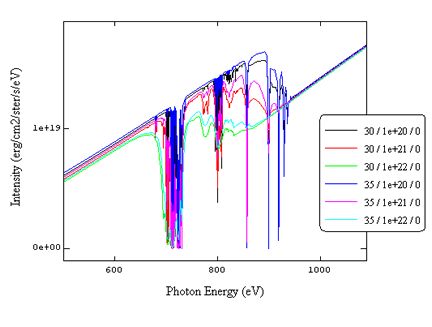
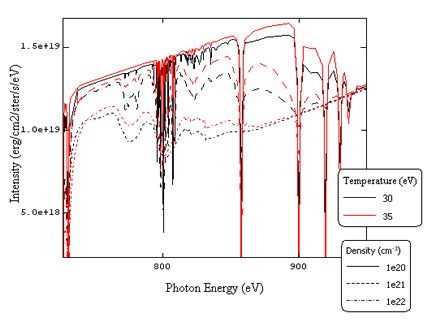
The figure below shows a plot from PrismSpect. The lines represent spectra at different temperatures and densities.
- Group the lines by temperature and density values. Double clicking on a line, or selecting the menu command Graph | Line Properties, will display the line properties dialog:
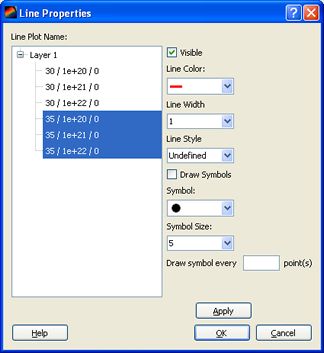
- Select all lines at the same temperature and give them a common color.
- Select all lines at the same density and give them the same line style.
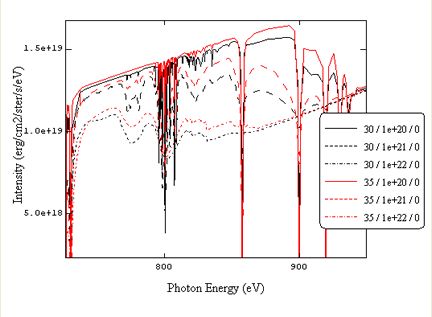
We now have the plot and legend shown below:
- Double click on the legend to edit it. The Textbox Properties dialog will be shown.
- Delete the contents of the text box.
- Density legend:
- Add a header line e.g. 'Density (cm^-3)' and press Enter.
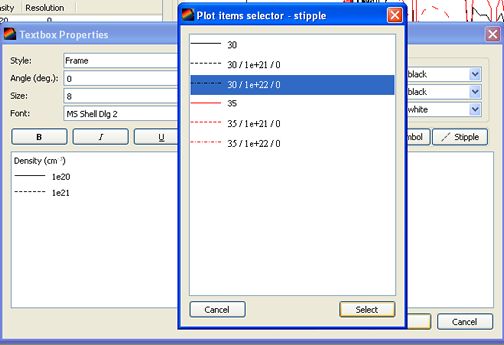
- Click on the Stipple button and select the plot whose stipple attribute will be used for the first density value.
- Type the density value and press Enter.
- Repeat for the next two density values.
- The image below illustrates selecting the stipple attribute for the third density value.
- Click on OK.
- Temperature legend.
- Create a new text box via the Text | New Text Box menu item.
- Add a header line e.g. Temperature (eV)' and press Enter.
- Click on the Color button to select the plot whose color attribute will be used for the first temperature value.
- Type the temperature value and press Enter.
- Repeat for the next temperature value.
- Click on OK.
The legends should now appear as shown in the image below.
| Copyright © 2000-2026
Prism Computational Sciences, Inc. |
VISRAD 21.1.1 |