| CONTENTS | GLOSSARY | SUBJECT INDEX | SEARCH DOCUMENTATION |
To display the properties of an individual surface element, set the mouse mode in the Main Window to display surface properties (![]() ), and then pick on the surface element in the Main Window using the left mouse button. A dialog box will be displayed
listing the following properties for the picked surface element.
), and then pick on the surface element in the Main Window using the left mouse button. A dialog box will be displayed
listing the following properties for the picked surface element.
At the top of the dialog:
When AMR grids are employed, the centroid position displayed is now that of the AMR (i.e., subdivided) surface element.
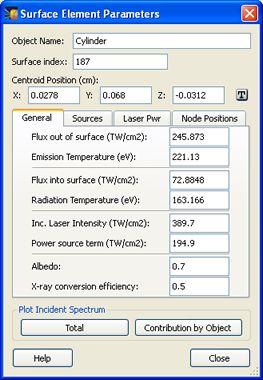
Properties in the General tab (see left figure below):
The position of the surface element centroid can be readily viewed in another coordinate system by using the Coordinate Transformation Tool. To do, hit the ![]() button. When doing this, the centroid ("Base") position is automatically entered.
button. When doing this, the centroid ("Base") position is automatically entered.
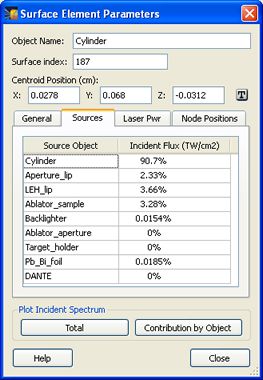
In the Sources tab, the contribution to the incident flux at the picked surface element is shown for each target component in the grid (see right figure below).
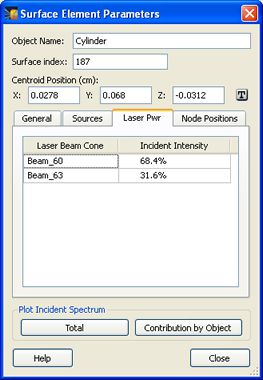
In the Laser Pwr tab, the contribution to the incident laser intensity on the picked surface element is shown for each laser beam cone (see left figure below).
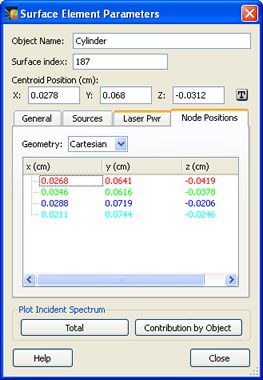
In addition to showing the centroid position of the picked surface element in the upper portion of the Surface Element Parameters dialog (see above), the node positions are also shown in Node Positions tab (see image below, right). The nodes are also shown in the Main Graphics Window, using different colors (red, green, blue) that map to the values shown in the table. The purpose of displaying node position information is to facilitate obtaining more accurate information on positioning, such as identifying the edge or corned of a clipped target component.
To display the properties of a different surface element, set the mouse mode again for displaying surface element properties, and then pick on the surface element.
Note that if quantities are not up-to-date, a value of zero may be displayed.
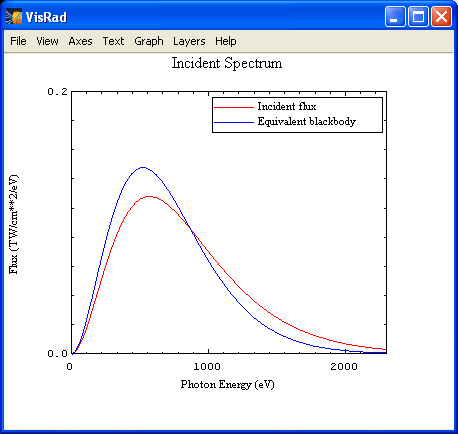
To show the incident spectrum for the picked surface element, click the Total button at the bottom of the dialog. The contribution to the incident spectrum due to individual target components can be viewed by clicking the Contribution by Object button. An example plot of the incident spectrum for a picked surface element is shown below:
| Copyright © 2000-2026 Prism Computational Sciences, Inc. | VISRAD 21.1.1 |