| CONTENTS | GLOSSARY | SUBJECT INDEX | SEARCH DOCUMENTATION |
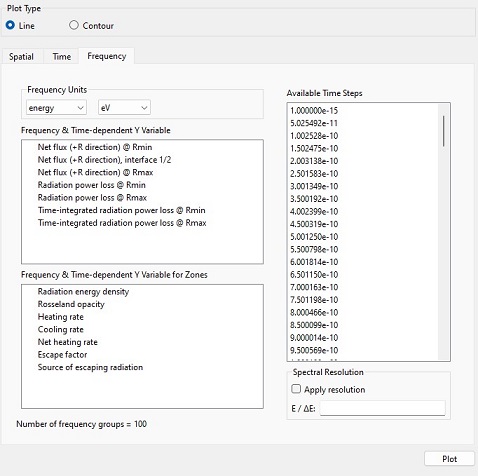
Frequency-dependent line plots are controlled in Frequency tab widget.
Variables listed in the Frequency & Time-dependent Y Variable box are written to the plot file for all HELIOS output times.
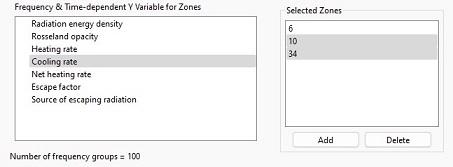
Variables listed in the Frequency & Time-dependent Y Variable for Zones box are written to the plot file only at simulation times when frequency-dependent radiation output is requested. These are quantities that are plotted for selected zones (i.e., volume elements).
To generate a plot, select one item from one of the lists one the left. Then, select one or more times from the list of times. Data for all the times selected will be displayed on a single plot.
An instrumental resolution can be applied to a frequency-dependent data by checking on the Apply resolution box below the list of times, and entering a value for E / DE.
When plotting variables from the Frequency & Time-dependent Y Variable for Zones box, zones must be selected by clicking on the Add button and selecting individual zone indices from the dialog box that is shown.
| Copyright © 2002-2025 Prism Computational Sciences, Inc. | HELIOS 11.0.0 |