
| CONTENTS | GLOSSARY | SUBJECT INDEX | SEARCH DOCUMENTATION |
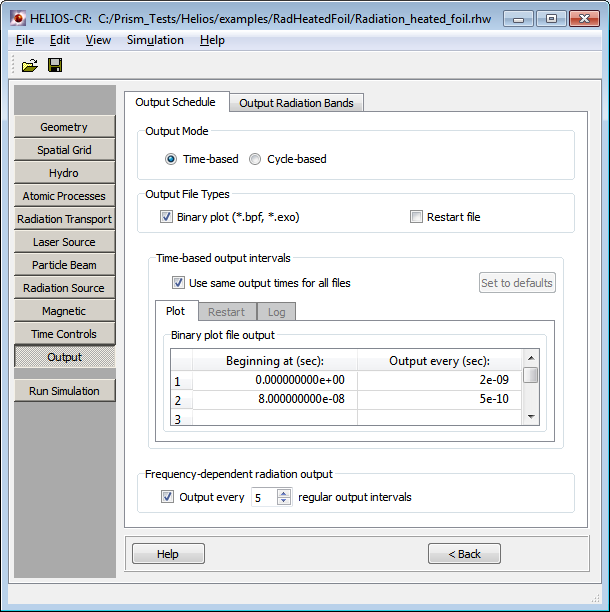
During a HELIOS simulation, output is generated for a Log file, a Plot file, and a NetCDF file. The frequency at which data is written to these files is controlled by the Output parameters widget.
The output to these files can either be based on the simulation cycle count ("cycle-based") or the simulation time ("time-based").
For time-based output, a constant time interval for output can be specified by simply entering the output frequency in the "Output every" column.
The data for plotting can be written to a binary *.bpf file and
to a NETCDF *.exo file
(http://my.unidata.ucar.edu/content/software/netcdf/index.htm).
The data available for plotting are identical.for both file
formats.
Users may want to vary the output frequency, depending on the simulation time. For example, to start with an output frequency of every 5 nsec, enter 0 in row 1 of the Beginning at column, and 5e-9 in the Output every column. Then to switch to a different output frequency of every 1 nsec at a simulation time of 90 nsec, enter 9e-8 in row 2 of the Beginning at column, and 1e-9 in the Output every column.
For CR calculations only, there is also an option to write a
restart file (<run_name>.hrs). A restart file enables a
calculation to be restarted at any time step where the file was
written. To select this option, click on the Restart file check
box.
Output scheduling may be done independently for the Log, Plot, NetCDF and Restart files, or together. To use the same parameters for all files, use the Plot tab, and check the box Use same output times for all files.
Alternatively, output can be based on the simulation cycle count. To use this option, select the Cycle-based button. In the example below, output is written to the Plot, NetCDF, Restart and Log files every 1000 cycles up to cycle 25000, and every 500 cycles thereafter.
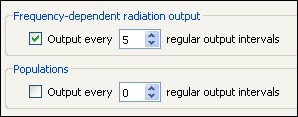
Also, for CR calcualations only, there is an option to write out the atomic level populations. The populations will be written at times after CR has started. This option can lead to very large output files and should be used with caution:
Ouput for Radiation Bands can be specified by the user. For each band specified, the time-dependent radiation power in the band, the time-integrated radiation energy in the band, and the the conversion efficiency (i.e., the ratio of output energy in the band to the laser input energy) are written to the plot file and can be plotted using HydroPLOT.
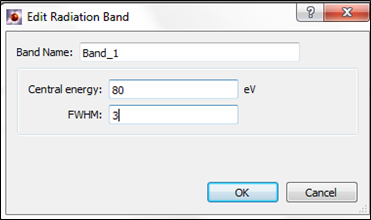
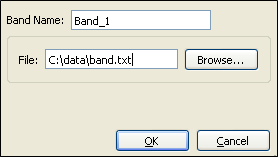
The radiation bands can be defined using either Square or Gaussian bands, or by supplying a Filter Response File. Parameters for the radiation bands are specified in the Output Radiation Bands tab of the Output Widget.
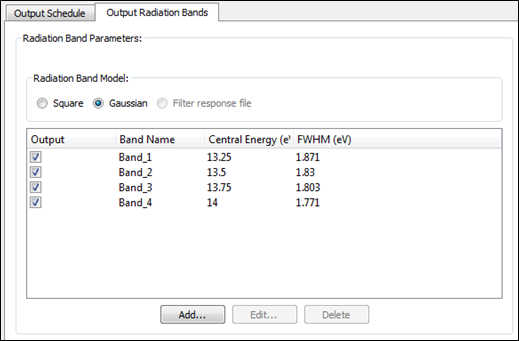
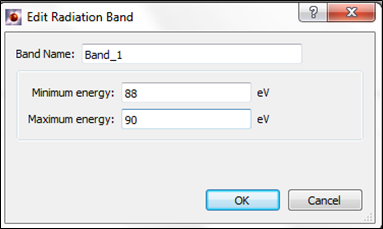
Bands are added by selecting the model to use - Square, Gaussian or a Filter response file - and clicking on the Add button. A dialog will be displayed where the name of the band and the data to define the band can be entered. The required data is:
If there is more than one band, all the bands should be specified with the same model.
Data will only be written if the Output box is checked.
Bands can be edited by selecting a band and clicking on the Edit button or by double-clicking on a band.
Bands can be deleted by selecting a band and clicking on the Delete
button.
| Copyright © 2002-2025 Prism Computational Sciences, Inc. | HELIOS 11.0.0 |