
| CONTENTS | GLOSSARY | SUBJECT INDEX | SEARCH DOCUMENTATION |
After setting up each of the spatial regions for the HELIOS simulation, the zoning (or mass distribution of zones) must be set up. In most cases, this can be accomplished using the Automatic Zoning option. For a Lagrangian code, it is important to have a smooth distribution of zone masses. Generally, relative mass differences between two adjacent zones should be within a few tens of percents.
Automatic zoning is based on the density, thickness, and number of zones specified for each spatial region. The automatic zoning algorithm utilizes an iterative procedure to determine the optimum zoning. In cases where this procedure encounters problems, the user can adjust the number of zones in a given region, using either the table at the top of the Preview Zoning dialog or the Spatial Grid parameters widget in the main window. To aid the user, the average mass per zone for each region is displayed in the rightmost column of the table. Note, that the number of zones for each spatial region should be greater than or equal to 3.
Zoning may also be improved by:
The actual zone widths at the plasma or region extremes may be different from the specified values. If this is the case, a warning will be shown with an option to view the specified and actual widths. The minimum zone width allowable in the calculation is 1e-8 cm.
This model simply sets up the spatial grid such that the masses of all zones in a given region are equal. Using this model, mass matching at region boundaries may be poor.
For complete control of the zoning process, the values of the zone boundaries for each zone can be specified, unless one of the regions has a variable density. After selecting Table for the zoning model, clicking on the Setup... button will display a one column table. Values can be entered directly into the table, or values stored in an ASCII file can be imported. See Entering Table Data for more details. The number of zone boundary values entered must be consistent with the total number of zones, and the boundary values must be consistent with the width of each region.
The effects of any changes to the zoning method or the data used for zoning can be seen by clicking on the Update Plot button.
The changes will be stored in the workspace when the Save button is clicked. If the Save and Close button is clicked, the zoning dialog will also be closed.
If the Cancel button in clicked, any unsaved changes will be lost.
A display of the mass distribution in the zones is shown in the Preview Zoning dialog. This dialog is automatically displayed when the user starts a new HELIOS simulation. The dialog shows a plot of the mass in each zone as a function of zone index. It is also possible to show the relative mass between adjacent zones by selecting the Relative Mass button.
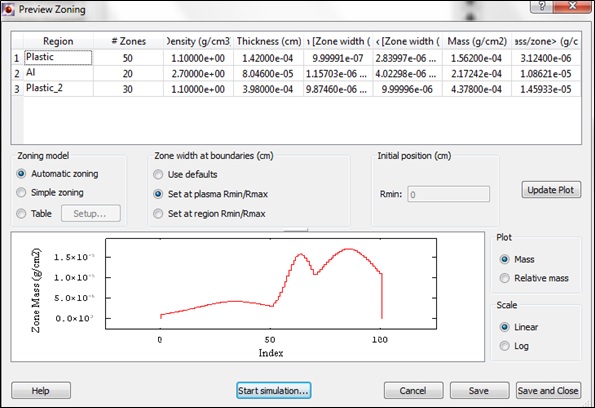
There is a splitter bar running horizontally above the graph display. Moving the bar up or down alters the space given to the table and controls at the top of the Zoning Preview versus the space given to the graph.
| Copyright © 2002-2025 Prism Computational Sciences, Inc. | HELIOS 11.0.0 |