
| CONTENTS | GLOSSARY | SUBJECT INDEX | SEARCH DOCUMENTATION |
SpectraPLOT is used to generate simulated diagnostic signatures, as well as graphical data that allows users to discern the physics affecting these signatures. A variety of output can be viewed for any SPECT3D run contained in the Run Results List.
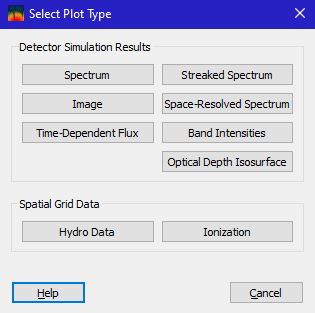
The types of plot windows that can be displayed using SpectraPLOT are listed in the table below.
Plot Widget |
Quantities Displayed |
Instrumental Effects |
|---|---|---|
Line plots of Intensity vs. Photon Energy |
Spectral resolution; Time-integration; Filtering |
|
Contour plots of Intensity, Filtered-Intensities, Monochromatic Intensities and Optical Depths, Areal Densities |
Spatial resolution; Time-integration; Filtering |
|
Line plots of Absolute Flux vs. Time |
Filtering |
|
Contour plot of Intensity vs. Photon Energy and Time |
Spectral resolution; Time resolution; Filtering |
|
Contour plot of Intensity vs. Photon Energy and One Spatial Dimension of Detector Plane (integrated over 2nd dimension) |
Time-integration; Filtering |
|
Line plots of frequency-intengrated intensity vs. time |
Spectral resolution; Filtering |
|
Isosurface plot for Optical Depth |
None |
|
Line plots showing a variety of physical properties that affect the intensity of a selected pixel in an Image Plot Window |
None |
|
Space-dependent plots of hydrodynamics data used in the SPECT3D simulation |
None |
|
Space-dependent plots of SPECT3D results for ionization, mean charge, and atomic level populations |
None |
Additional details on each of the plot types can be viewed by clicking the link in the above table.
Note that for plot windows containing line plots, multiple plots items (i.e., line plots) can be added to a plot window. For contour plots, only one plot item is contained in each plot window.
Space-dependent hydro data can be displayed in 3-D, or in plots using the number of dimensions contained in the hydro dataset (e.g., 1-D if using 1-D planar, cylindrical, or spherical geometry). If displaying in 3-D, multiple plot items (either contour slices or isosurfaces) can be added to the a window.
For a discussion on Instrumental Effects, see Applying Instrumental Effects .
Displaying Plots
New plots can be displayed by clicking on the New Plot Window button located in the upper left corner of the Main Window. After clicking the New Plot Window button, select one of the supported plot window types.
When displaying a new Detector Simulation Results plot window, default parameters are loaded into the Instrumental Effects widget. Edit the parameters for the new plot item, and click OK or Apply to add the plot item to the plot window.
A list of plot windows is shown in the Windows List on the left panel in the Main Window. For the active plot window, a list of plot items contained in that plot window is shown in the Plot Items List below the Windows List.
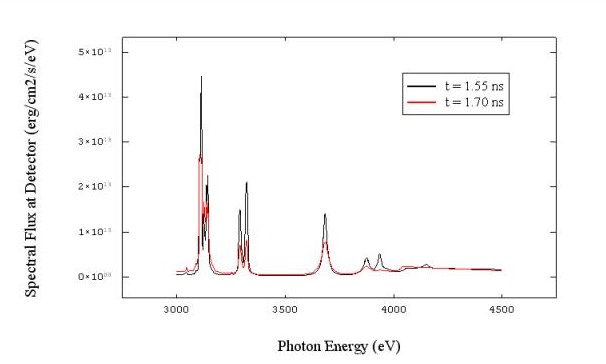
Line Plot Windows
Line plot windows (e.g., Spectrum, Time-Dependent Flux) can contain one or more plot items (each curve is a plot item). The plot items need not come from the same SPECT3D run or the same detector. An example of a line plot widget is shown below.
Line plots can be edited by double-clicking on a plot item in the Plot Items List. When doing this, its properties are displayed in the Plot Item Properties widget.
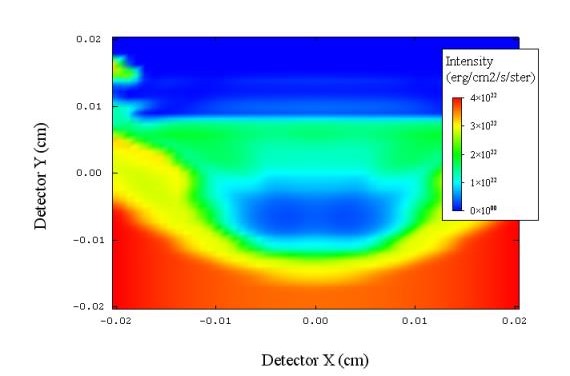
windows (e.g., Image, Streaked Spectrum, Space-Resolved Spectrum) contain only one plot item. An example of a contour plot is shown below.
Contour Plot Windows
Contour plot
The parameters of the contour plot can be edited by double-clicking on the plot item in the Plot Items List.
Additional information on editing the graphical properties of items in line plot and contour plot windows, see Editing Graphs.
3-D Plot Windows
3-D plot windows are available when displaying results on the plasma spatial grid (e.g., ionization and atomic level population data, hydro data, and optical depth isosurfaces).
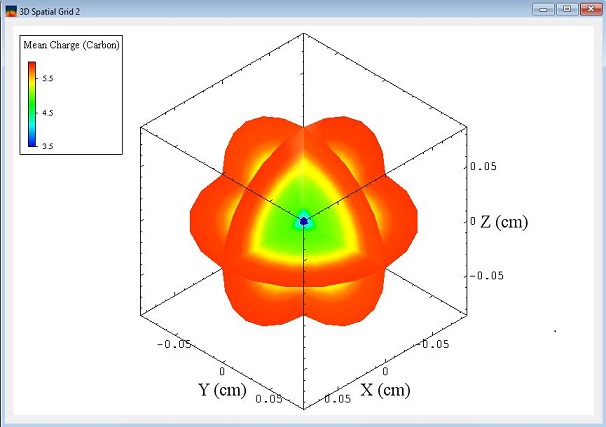
3-D plot windows support display multiple contour slice and/or isosurface plot items.
| Copyright © 2024 Prism Computational Sciences, Inc. | SPECT3D 20.5.0 |