| CONTENTS | GLOSSARY | SUBJECT INDEX | SEARCH DOCUMENTATION |
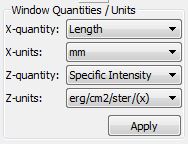
In the lower left corner of the SpectraPLOT Main Window, the quantity being displayed in a plot window can be specified, along with its units.
The options available depend on the type of plot window being displayed. The examples below are for Spectrum (left), Image (center), and Streaked Spectrum (right) plot windows.
X-quantities and units refer to the horizontal axis. Y-quantities and units refer to the vertical axis. Z-quantities and units refer to the color scale in contour plots.
For Image plot windows, Y-quantities and units are not shown, as the values used for the vertical axis are the same as those for the horizontal axis.
Spectral energy-related quantities can be displayed either in units of Photon Energy or Wavelength.
Intensity-related quantities can typically be displayed either as the Specific Intensity (also called Spectral Radiance) or the Flux at the Detector.
Options for spectral intensity units, which depend on the units chosen for the spectral energy quantity, are sometimes shown as "/(x)". For example, when the X-quantity for a Spectrum plot window is Wavelength in angstroms, the spectral intensity is displayed in units of "per angstrom" (e.g., erg/cm2/s/ster/A).
| Copyright © 2024 Prism Computational Sciences, Inc. | SPECT3D 20.5.0 |