
| CONTENTS | GLOSSARY | SUBJECT INDEX | SEARCH DOCUMENTATION |
SPECT3D is capable of reading in and displaying data from a variety hydrodynamics simulation codes. Supported hydro output formats include:
The data contained in the hydro files are contained in arrays that are identified through the use of "variable names." SPECT3D can be used to display data contained in these files.
To display data from a file, select Display | Hydro Data. A list of available variable names is shown in the left box of the display widget. If the variables have been previously mapped to a SPECT3D plasma quantity or material, the mapped quantity is shown in parentheses.
In addition to space-dependent quantities, frequency-dependent quantities, such as the radiation flux at the outer boundary, can also be displayed.
A list of simulation times at which data was written to the file is shown in the right-hand box.
To view a plot of the data, select both a variable name and select a simulation time. (A sample temperature plot is shown below.) Multiple variables can be selected and plotted. If the time is selected first, click on the Display button to show the new variables.
A separate plot window is used for each quantity. When a new simulation time is selected, the plot data of all quantities being displayed are updated automatically.
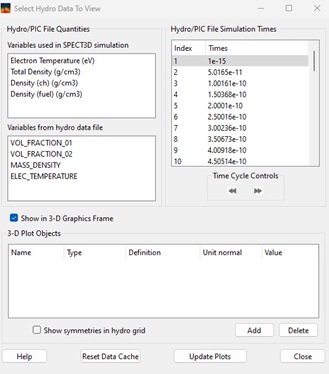
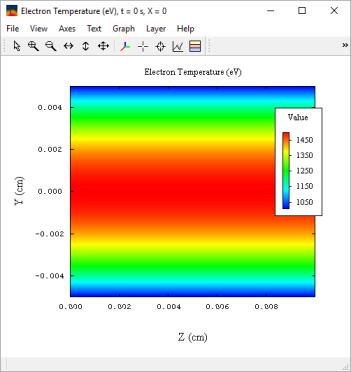
For 3-D hydro data sets, contour slices or isosurfaces can be displayed by checking the "Show in 3-D Graphics Frame" box. In this case, the value of either x, y, or z is specified. In the example above, the contour slice for the temperature in the x = 0 plane is shown.
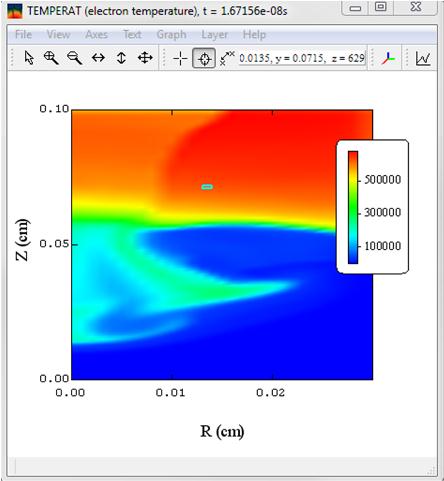
The values of plasma variables and node positions for a volume element can be displayed for any hydro dataset utilizing 2-D geometry (2-D Cartesian or 2-D cylindrical r-z). Images of the hydro data are displayed by selecting the Display | Hydro Data menu item. To show the data, select the Data icon ![]() on the tool bar and click on a point in the plot. The selected zone is highlighted, and a dialog showing the data is displayed (see right image).
on the tool bar and click on a point in the plot. The selected zone is highlighted, and a dialog showing the data is displayed (see right image).
.

For information on how to modify the plot parameters or save data and/or images from the graph, see the PrismPLOT Users Guide.
A set of Time Cycle Controls is shown below the list of simulation times. These are used to facilitate stepping through the list of simulation times.
The function of these buttons are (from left to right):
| Copyright © 2024 Prism Computational Sciences, Inc. | SPECT3D 20.5.0 |