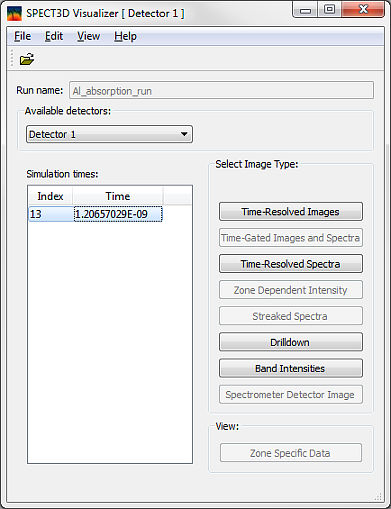

Results of Spect3D calculations can be viewed with the Visualizer utility. Visualizer can be started at the end of the calculation or at any time after the calculation is completed by double-clicking on file <run_name>.swc in <run_name> directory (in this example Al_absorption_run.swc). The Visualizer main window is shown below. Depending upon the type of the calculation, some of the options may be disabled.
| Copyright © 2024 Prism Computational Sciences, Inc. | VISUALIZER 20.5.0 |