CONTENTS
GLOSSARY
SUBJECT INDEX
SEARCH DOCUMENTATION
Example: Al K-shell absorption spectra
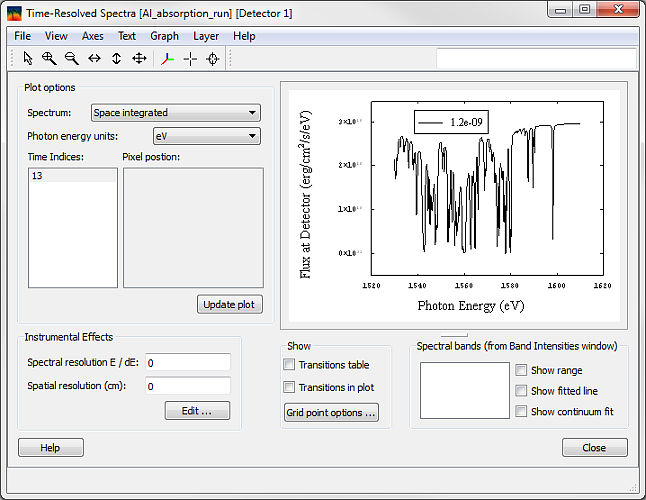
Displaying spectra and applying spectral resolution
Clicking on the
Time Resolved Spectra
button opens a new window showing the simulated spectrum. For details on plot controls see the
PrismPlot manual
.
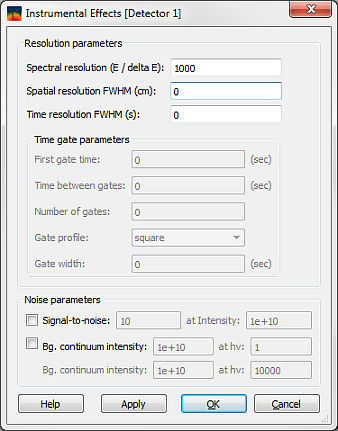
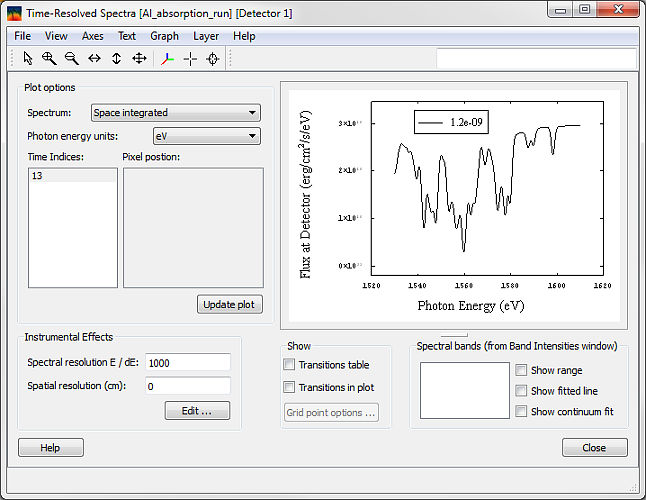
A spectral resolution can be applied to the synthetic spectrum to allow a direct comparison with experimentally measured data.
Click on the
Edit ...
button to show the
Instrumental Effects
dialog.
Enter
1000
in the
E/dE
field.
Click the
OK
button.
Next
Copyright © 2024 Prism Computational Sciences, Inc.
SPECT3D 20.5.0