
Example: Al K-shell absorption spectra
Displaying transition information
For DCA
elements, Visualizer can display line transition information so that the spectral
features can be easily identified.
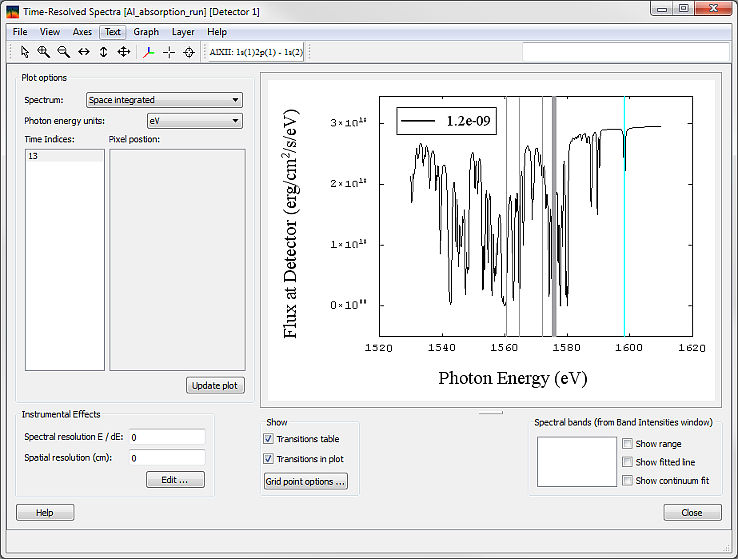
- Click on Edit ... and in the Instrumental Effects dialog, clear the value in E/dE field (or enter 0 for infinite
resolution) and click on OK.
- Under Show: check the boxes Transitions table and Transitions in plot. The
transition table will open in a new window.
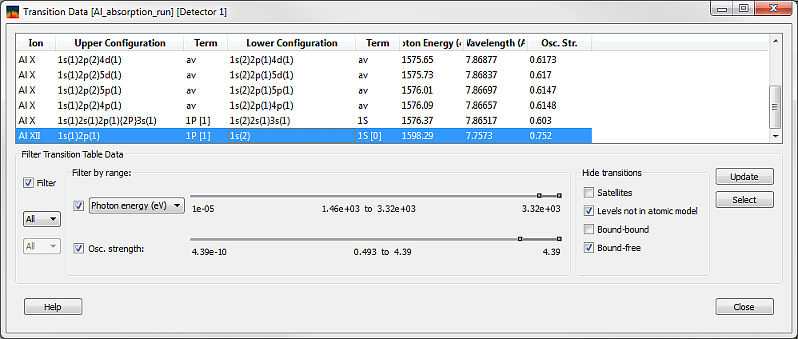
- To show strong bound-bound transitions: in the transitions window, move the photon energy slider to only include those transitions within the spectral range, move the minimum oscillator strength slider to ~
0.5, check the Levels not in atomic model and Bound-free
check-boxes and click on the Update button.
- Select any transition in the table (in this example, Al He-alpha). A corresponding
transition indicator in the spectral window will be highlighted.
Next
| Copyright
© 2024 Prism Computational Sciences, Inc. |
SPECT3D 20.5.0 |