Example: Argon Doped Implosion
Displaying time gated images and spectra
Synthetic time gated images and spectra allow for direct comparison with experimentally
measured quantities by performing a suitable time integration over instantaneous
simulation results. To generate time gated images:
- In the main Visualizer window click the Time Gated Images and Spectra button. The time gated
images window opens.
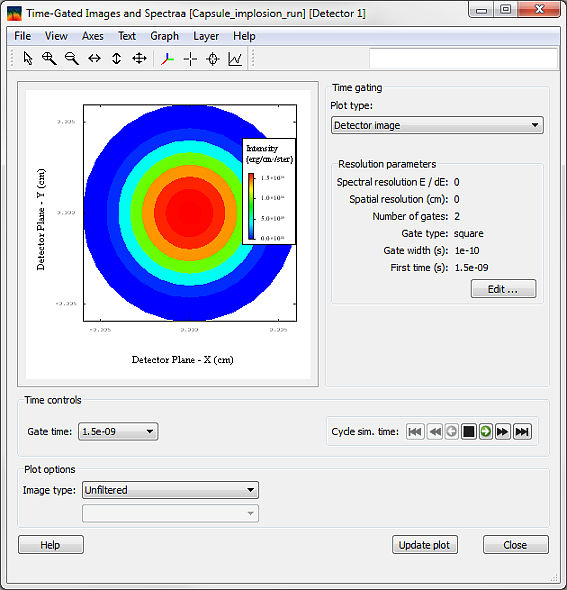
- Leave the default value (Detector image) in the Plot type combo-box.
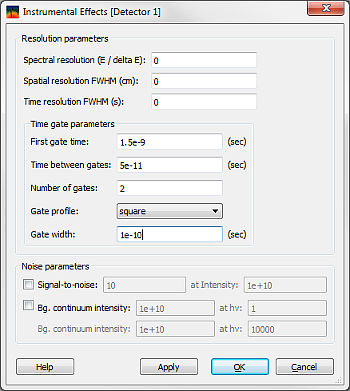
- Click on the Edit... button to show the Instrumental Effects dialog.
- Enter 1.5e-9 for the first gate time.
- Enter 5e-11 for the time between gates.
- Enter 2 for the number of gates.
- Leave the default (square) gate profile.
- Enter 1e-10 for the gate width.
- Click the OK button.
- Click the Update plot button.
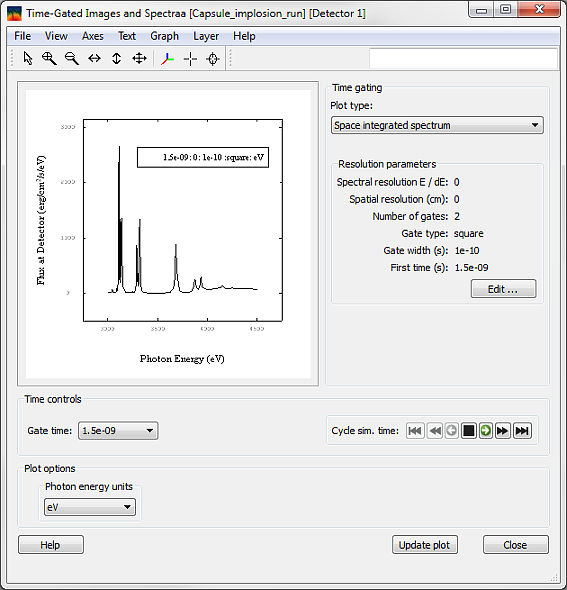
To generate time gated space integrated spectra:
- Select Space integrated spectrum in the Plot type combo-box.
Next
| Copyright
© 2024 Prism Computational Sciences, Inc. |
SPECT3D 20.5.0 |