SPECT3D revision summaries are shown below versions prior to 13.0.0:
Version 12.6.1
Bug fixes :
PROPACEOS files containing non-LTE energy resolved opacity
data are now read correctly.
Tabular values used to define the line shape of an X-ray
scattering source can have negative electron energies relative
to line center.
Version 12.6.0
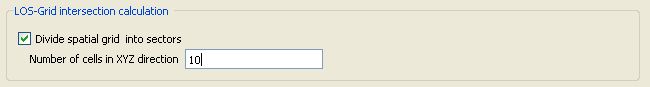
The 'divide spatial grid into sectors' option is now
available for R-Z geometry. Using a relatively large number of
sectors (e.g. 100 - 200) can yield large increases in
calculation speed depending on the complexity of the spatial
grid and portion of the grid needed to construct the detector
image.
SPECT3D now uses the latest version of the XRTS code (version
6.1) for the X-ray scattering calculation; the X-ray scattering
user interface has been updated :
New options are available for bound-free normalization,
effective electron mass, Doppler broadening.
The 'Use ion temperature' option is now available in the
gui.
The ion temperature used for each zone in the the X-ray
scattering calculation can now be set by multiplying the
electron temperature by a user specified fraction.
The level of continuum lowering can be set to a
user-specified value.
Controls have been added to set the bounds for the minimum
and maximum number density and electron temperature for which
a scattering calculation will be carried out . Upper and lower
bound can be switched on and off independently.
An XRTS input deck containing the run parameters can be
generated during the Spect3D calculation. In the case of a
multi-cell calculation, files are only generated for those
cells where there was a problem with the scattering
calculation.
Bug fixes :
Photon energy points in an external backlighter (e.g. Visrad
file) are now added to the continuum grid by default.
Contour plot slices through 3-D data using the hydro data
view now have the correct x and y axis labels.
Detectors can now be activated/de-activated as expected by
clicking on the corresponding checkbox. Previously, the
'active' status of a detector could only be changed if it was
first selected from the list, and often settings were
overwritten with those of another detector.
VISUALIZER
The Coordinate and Data buttons on plot
toolbars are now working correctly.
Version 12.5.0
Improved support for large-scale, multi-dimensional hydro
datasets:
The LOS-intersection algorithm has been improved and should
lead to substantial speed increases for large 3-D data sets.
Several optimizations have been made to the LOS-opacity
calculation to increase execution speed.
Multi-threading support has been added to graphics for
generating contour plot slices from 3-D hydro datasets.
When generating contour plot slices, the algorithm for
treating cases in which volume element walls lie in the plane
of the slice has been improved.
Multi-threading support has been added for reading in and
storing hydro data.
A Reset Data Cache button has been added to the
widget controlling the display of hydro data. To avoid
unnecessary re-reading of hydro data, flags are used to track
most recent data read. Resetting the data cache flags forces
data to be re-loaded.
The K-beta emission modeling for M-shell ions (i.e.,
for ions which typically have > 10 bound electrons) has been
updated. A more accurate model for the shift in wavelength of
the K-beta lines, which is based on comparisons with results
from first-principles atomic structure calculations, has been
implemented.
Multi-threading over detector pixels is now used for
calculations that use only opacity lookup tables and have
>100 detector pixels.
The progress monitor widget has been modified to update only
once per second.
Version 12.2.0
Use of 3-dimensional hydro data is available for all users.
The option to use spatial sectors in the LOS-intersection
calculation for 3-dimensional data is now available for all
users.
There have been
numerous improvements to the X-ray scattering calculation -
the RPA model works correctly on
Windows platforms; the
NE_ZF_LOCK option now works correctly. Additional checks are now
made to avoid low values of electron number density that
previously caused convergence problems in the scattering
calculation.
VISUALIZER:
Legends
appearing in line plots are kept up-to-date with the list
of selected plots and are also updated when any changes
are made to the properties of the plotted lines (e.g. line
color, plot symbol).
Bug fixes:
The spatial sectors option for the LOS-intersection
calculation now works correctly for data read from Silo files.
Hydro data viewer: contour plots are now displayed correctly
in cases where a volume element surface lies exactly in the
contour slice plane.
The visual appearance and behavior of the lineout
tool has been improved.
A labeling inconsistency in the Materials widget
for 'single cell' calculations has been fixed.
The working directory for a simulation is now set to be the
same as used in the previous calculation (if available) or the
same as the directory containing the currently loaded
workspace.
Version 12.1.0
X-ray scattering modeling for multi-cell grids is now
available to all users. By utilizing a multi-cell analysis, the
range of scattering angles and plasma conditions is treated more
accurately, thereby allowing for a more accurate simulation of
scattered spectra.
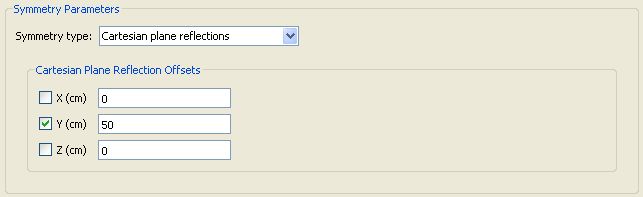
The option to reflect the plasma grid through planes that lie
parallel to the x-y, y-z, or x-z
planes is now available to all users. This allows users to take
advantage of symmetries utilized in hydrocode simulations. The
parameters used for utilizing this option are set on the Geometry
widget.
The number of processors to use for a simulation can now be
set when running in batch mode by using the command line
parameter "-n" followed by a number. This overrides the number
of processors set in preferences.
Binned spectral output (i.e., intensity integrated
for user-specified wavelength bands) can now be written using
ascii or binary format:
Vapor fraction overrides (not available to all users):
Overridden vapor fractions (i.e., specified with an
analytic expression) can be plotted.
The check box to use a hydro variable for the vapor
fraction no longer needs to be checked if an override is to
be applied.
A warning is now issued if vapor fractions are set for
some, but not all, materials.
VISUALIZER:
Results from steady state runs for different timesteps
can be merged together using a new Merge
runs tool. The workspace for each run should be
identical apart from the timesteps selected.
Bug fixes :
Program crash when attempting to plot data from a NETCDF
file when the data values were not written has been fixed.
VISUALIZER:
Fixed crash in Band Intensity Viewer when
working with results from a run with a single timestep.
Version 12.0.0
X-ray scattering modeling: (This model is in beta
form, and is not available to all users.)
The x-ray scattering library (based on the Oxford
University code) has been updated to support easier
integration into the SPECT3D package when future
modifications are made .
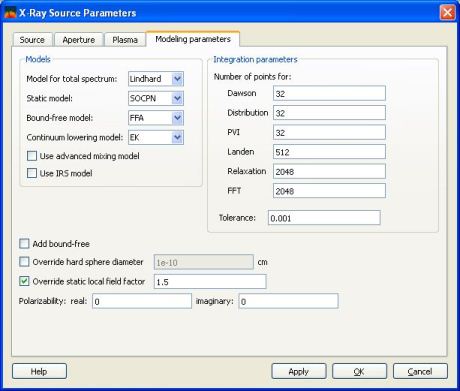
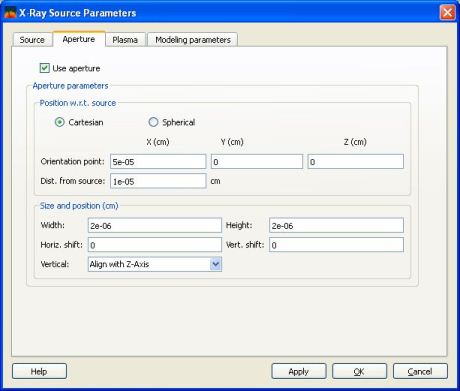
There is a new user interface for entering parameters for
the x-ray source modeling.
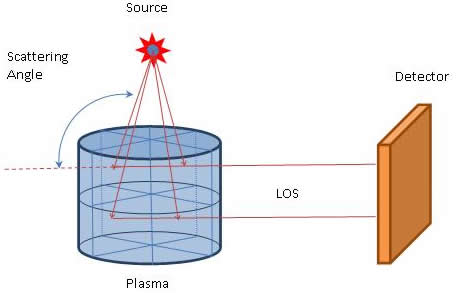
An aperture can now be used to limit lines-of-sight that
extend through the plasma. At present, this can be used to
restrict the angular distribution of photons emanating from the
x-ray source used when x-ray scattering modeling is employed.
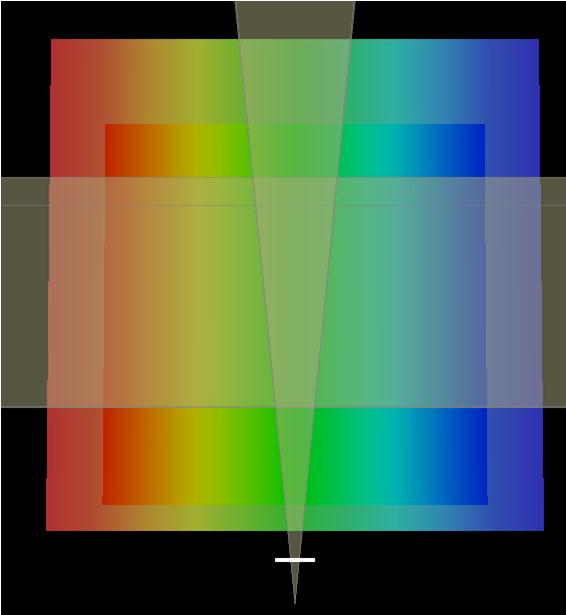
Detector-Target Orientation Viewer: Support has been
added to show the x-ray source location and, if an aperture is
used, the region of the target plasma that is irradiated by
photons emanating from the x-ray source.
For 2-D and 3-D plasma grids, the default LOS-Grid
Intersection Model has been changed to Evaluate for
Individual Elements. For 1-D grids, the Load Entire
Spatial Grid option is always used.
The maximum number of detectors that can be specified has been
changed to 99.
When attempting to run a time-dependent non-LTE atomic
kinetics simulation when only non-DCA materials are used in the
calculation, a warning is issued and the calculation is
terminated.
Bug fixes:
A problem that occurred when including photoionization
modeling for inner-shell transitions that produce Ka/Kβ
emission from M-shell ionization stages, while also having
regions that contain only non-DCA materials, as been fixed.
A problem occurring when plotting data for 1-D and 2-D AMR
grids has been fixed.
In simulations where more than one detector is used and
non-local collisional-radiative modeling is employed (i.e.,
non-LTE modeling including photoionization/photoexcitation),
a problem occurring which resulted in the populations not
being set correctly when computing the intensity incident on
the second and subsequent detectors has been fixed.
VISUALIZER
Rate Coefficients Table: When displaying
results values of photoionization rates for inner-shell
transitions that produce Kα/Kb emission from M-shell
ionization stages, results are now shown for the correct
spatial zone (volume element).
A problem occurring when plotting XRD fluxes with data
produced during simulations with SPECT3D 11.5.0 has been
fixed.
Version 11.5.0
When including modeling for inner-shell transitions producing
Kα/Kβ
emission from M-shell ionization stages, the effects of
photoionization are included when computing atomic level
populations.
Improvements for 3-D spatial grids:
Substantial improvements have been made to algorithms
used to compute the intersections of the hydro grid with
lines-of-sight (LOSs) extending from the detector through
the plasma. The algorithms are applicable when using the LOS-Grid
Intersection Model for Individual Elements
(set on the Simulation Type widget).
The implementation for multi-threading (used on multi-core
desktops and nodes of Linux clusters) has been improved.
Smaller bundles of LOSs are used to improve load balancing.
Volume elements may be grouped into sectors (or
sub-domains), and LOS-sector intersections are first
performed to determine whether volume elements within a
sector need to be evaluated. This option, when available, is
set on the Geometry widget.
The above upgrades have resulted in more than an order of
magnitude reduction in computing time for cases with ~ 50
million volume elements.
Improvements have been made to significantly reduce memory
(RAM) requirements when utilizing large-scale
multi-dimensional hydrodynamics grids.
For 2-D and 3-D Cartesian grids, the option to reflect the
plasma grid through planes that lie parallel to the x-y,
y-z, or x-z planes is now available. The
parameters used for utilizing this option are set on the Geometry
widget. (This model is in beta form, and is not
available to all users.)
.
Plasma Variables Mapping widget:
There is an option to automatically set default values for
hydro files generated by either HELIOS-CR or PlasmaGEN.
To use this, press the Set to Defaults button.
Variables to be used for material fractions or partial
densities are now selected using check boxes.
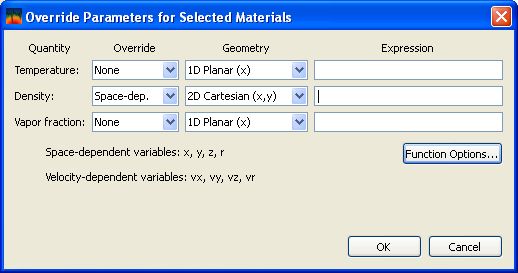
Materials widget: The values from the hydro file can
be overridden by selecting one or more materials and clicking on
the Override Data... button. (This model is in beta
form, and is not available to all users.)
.
The maximum number of Detectors allowed for a
simulation has been increased from 5 to 100.
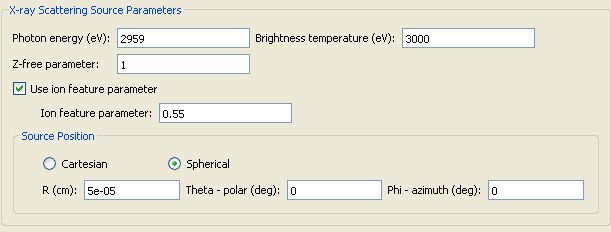
An x-ray scattering model (based on G. Gregori formalism) has
been added. The x-ray scattering source characteristics are
specified on the Backlighter widget (This model is in
beta form, and is not available to all users.)
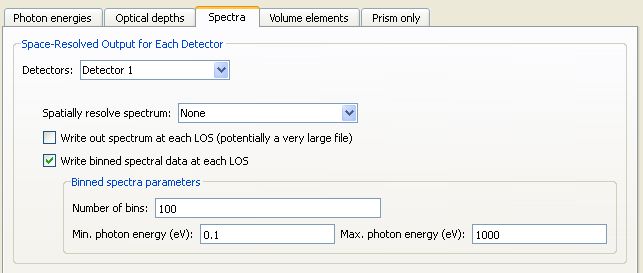
An option has been added to write out the spectral data for
each line of sight in a moderate number of photon energy bins.
Parameters for this option are specified on the Spectra tab
of the Output widget. This option has been added to
support generating filtered images in VISUALIZER,
where the filter functions are specified in VISUALIZER
(s opposed to SPECT3D).
When utilizing tabulated line profile data, treatment of the
He-like 1s2p configuration requires use of an atomic
model with either fine structure splitting or term splitting for
that configuration (for computing both atomic level populations
and spectra). If this is not done, a warning message is
displayed and the simulation is terminated.
The output files containing atomic level populations (*.pop),
atomic transition data (*.edt), and zone-dependent data (*.zdt)
have been updated to include the isotope index for DCA atoms.
Modeling involving inner-shell transitions producing Ka/Kβ emission
from M-shell ionization stages has been updated to support
parallel simulations.
The dense plasma Stark line width modeling for K-shell ion
resonance lines has been updated. The updated modeling, which is
based on fits to detailed Stark broadening simulation results,
has been extended to cover elements with Z up to 32.
VISUALIZER: Rate coefficients are available for
virtual atomic levels as well as explicit levels.
Bug fixes:
The species fractions for situations where different
isotopes of the same element are present in different
materials are now calculated correctly.
A problem that could occur when using tabulated line
profile data in which different photon energy grids existed
at different density points has been fixed.
For single volume element simulations involving
backlighters, the backlighter is now utilized for all
detectors. (The backlighter in single volume element
calculations had been ignored since support for multiple
detectors was added.)
VISUALIZER:
Isotope names are now displayed correctly and the
correct populations are now displayed in drilldown.
Previously the populations for the same atom in a
different material might have displayed.
Drilldown plots showing atomic level population data
when only one volume element is present are now
displayed correctly. Previously no plot was shown.
A crash that sometimes occurred in drilldown plots
showing atomic level population data when more than one
element was present has been fixed.
Version 11.0.0
Support has been added to post-process results from FLASH
radiation-hydrodynamics simulations (http://flash.uchicago.edu/site/)
when an AMR grid is used.
Support has been added to post-process results from HYDRA
radiation-hydrodynamics simulations in which SILO-PDB files (https://wci.llnl.gov/codes/silo)
are generated. This is supported only on Windows 64 and Linux
systems.
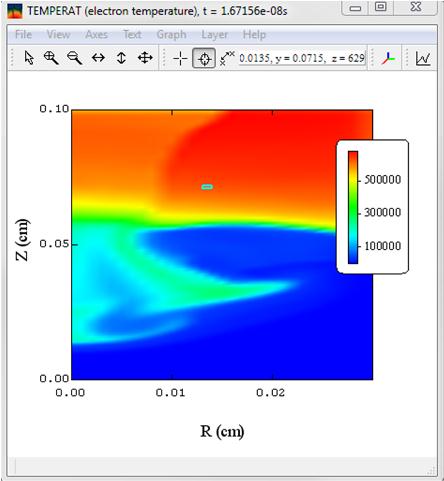
The values of all plasma variables and node positions for a
volume element can now be displayed for any hydro dataset
utilizing 2-D geometry (2-D Cartesian or 2-D cylindrical r-z).
Images
of the hydro data are displayed by selecting the Display
| Hydro Data menu item. To show the data, select the Data
icon on the
tool bar and click on a point in the plot. The selected zone is
highlighted, and a dialog showing the data is displayed (see
right image).
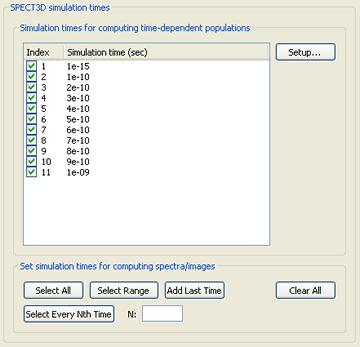
Simulation Times widget: Controls have been added to
aid in the selection of hydro times to be processed in a SPECT3D
simulation. The controls for selecting the times at which
spectra and images are computed in a time-dependent calculation
are similar.
If a workspace created with a later version of SPECT3D
is read in, a message will only be shown if the workspace fails
to read.
When an error is encountered which will prevent all time steps
from running correctly, the entire SPECT3D calculation
is now aborted.
The index of the hydro file time has been added added to the
*.sim file. The *.sim file format ID is now 2.
Bug fixes
A problem associated with computing the populations of
virtual autoionization levels of M-shell ions (i.e.,
atomic levels having a single K-shell vacancy for ionization
states having more than 10 bound electrons) has been fixed.
This bug affected SPECT3D versions greater than
8.1.0.
Fixed problem occurring when using the menu bar and tool
bars when displaying hydro data on the Mac.
In the Display Hydro/PIC File Data widget, the
unit in the label for the Hot Electron Energy Bins
has been changed from MeV to eV.
Fixed bug that caused a crash when computing LOS-grid
intersections when using the Individual Elements
model in 2-D Cartesian geometry.
Fixed problem that occurred when writing very small numbers
for XRD detectors.
Fixed crash that could occur when selected output cells
were shown for an AMR grid.
Fixed problem occurring when displaying grid extremes for
2-D cylindrical R-Z geometry. Incorrect values were being
shown.
Fix for crash that could occur if changes were made to the
plots of hydro data while stepping the plots through time.
Fixed a problem which resulted in levels with a very low
population controlling the convergence. The bug only showed in
multiple element simulations when one of the elements had most
of the population concentrated in one level.
Filter names are now written correctly to the image data
file (*.dti).
Fixed a bug that occurred when when the first photon energy
in a detector response function file is zero.
VISUALIZER
Plots of XRD filter fluxes vs. time are now correct.
Previously only a single point was shown.
Time-gated radial plots now update correctly on change
of time.
Fixed problem that occurred in a time-dependent
simulation when using an EXODUS file containing
only one time step.
Fixed crash that occurred if drilldowns are run on more
than one detector simultaneously.
Fixed problem for a crash that could occur if changes
were made to the plots of time-gated data while stepping
the plots through time.
Version 10.1.0
Support has been added for performing multi-threaded
calculation of line-of-sight/grid intersections when selecting
the LOS-Grid Intersection Model which computes
intersections with volume elements individually (selected on the
Simulation Type widget). This, along with other
efficiency enhancements, resulted in a reduction in CPU time of
a factor of ~ 20 for a 3-D test calculation with 20 million
volume elements on a desktop PC with an Intel i7 processor.
There is an option for time dependent calculations to choose
between using LSODE to solve for the populations or the standard
solver. The standard solver potentially converges in a shorter
time, but may be less accurate, depending on the number of
sub-steps specified. The option can be found on the Populs.
solution method tab of the Advanced settings
on the Kinetics Model widget.
The minimum and maximum values of the grid data, the
temperature data and the density data from a hydro file can be
viewed. To view the data, click on the View Data Extremes button
on the Hydro File Information dialog. The View
Grid Bounds button on the Detector - Target View
Settings dialog has been removed.
The description for using multipliers for rate coefficients
when computing atomic kinetics has been clarified.
VISUALIZER:
Noise can be artificially added to image data to better
compare with experimental images.
Support has been added for viewing hot electron densities
per energy group in Drilldown plots.
Bug fixes:
Selected plots of the hydro data have been updated to show
the correct units.
A bug which required NetCDF/EXODUS files to contain nodal
variable names has been fixed.
A bug associated with performing multi-threaded (desktop,
non-MPI, parallel) calculations where photoionization and
photoexcitation rates are computed for non-LTE, non-zero
thickness plasmas has been fixed.
Problems on Mac OS X arising from starting SPECT3D
or VISUALIZER with an expiring or expired license
have been fixed.
A bug which prevented spatially resolved spectra options
being set correctly for any detector except the first has
been fixed.
A crash which could occur when using the option to
compute the contribution to the detector intensity from each
volume element has been fixed.
Field for writing statistical weight in population files
was extended to support correct output for heavily collapsed
levels.
A bug associated with initializing the isotope index for
elements in PROPACEOS files with format < 4 has been
fixed.
VISUALIZER:
A bug associated with the spatial resolution applied
to a rectangular detector image has been fixed.
Version 10.0.0
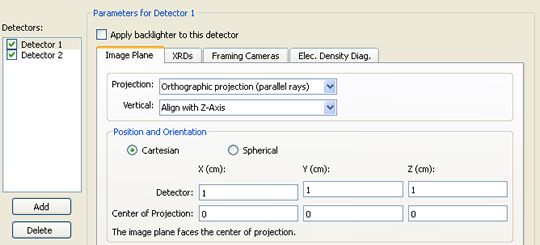
Multiple detectors now can be specified within a single SPECT3D
simulation.
Properties for each detector are independently specified,
including detector location and viewing volume, number of
pixels, and framing camera/XRD filters.
A maximum of five detectors can be specified on the Detector
widget.
There is an option to apply a backlighter to one or more
detectors.
The Spherical Crystal Projection Model, if
needed, can be specified for just one detector.
The orientation and positioning of each detector can be
viewed on the Detector-Target Orientation viewer.
More detailed output for individual volume elements can now
be saved to output files and displayed with VISUALIZER.
Data written for volume elements specified by the user currently
include: mean charge state, ionization fractions, and atomic
level populations. Data from different times steps can be saved
and plotted as a function of time.
All output parameters are now specified together on a new Output
widget.
The settings for writing spatially resolved spectra have
been moved from the Detector widget to the Spectra
tab of the new Output widget.
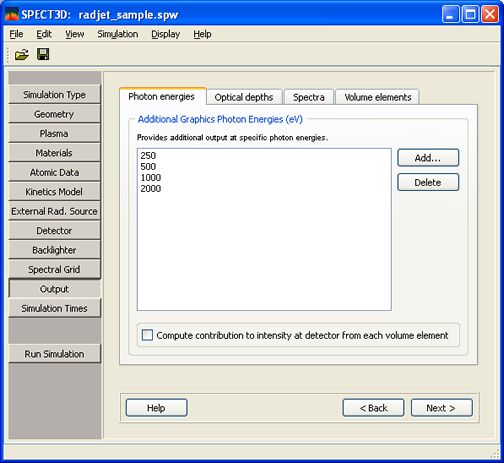
The settings for Additional Graphics Photon Energies
and Optical Depth Iso-Surface Values have been
moved from the Spectral Grid widget to the Photon
Energies and Optical Depths tabs of the
new Output widget.
.
The settings for the LOS-Grid Intersection Model
have been moved from the Detector widget to the Simulation
Type widget.
VISUALIZER:
Support for viewing results from multi-detector
calculations has been added.
Transitions window:
Sliders are now used to set filtering ranges for the
photon energy and the oscillator strength.
An Update button has been added to apply
the changes.
The table showing the transitions has been upgraded to
significantly reduce the time taken to load, sort and
filter a large number of transitions.
Volume element-specific data from a simulation can be viewed
by clicking on the Zone Specific Data button on the
main window.
A streaked spectrum can now be convolved in time as well as
wavelength. The resolution time is set in the Resolution
Parameters Dialog.
Drilldown plots showing quantity values of volume elements
along a line-of-sight are now shown in histogram form (i.e.,
quantity values are constant through a volume element and
change at the volume element boundaries).
Bug fixes:
A problem was fixed that sometimes caused a crash in MPI
pixel parallelization calculations when special photon
energies are used for detectors.
A problem associated with adding frequency grid points for
Doppler shifting effects when all fluid velocities are
negative has been fixed.
Detector-Target Orientation viewer:
Fixed problem for 1-D cylindrical plasmas where
sometimes view was shown with the wrong origin in the z-direction.