
| CONTENTS | GLOSSARY | SUBJECT INDEX | SEARCH DOCUMENTATION |
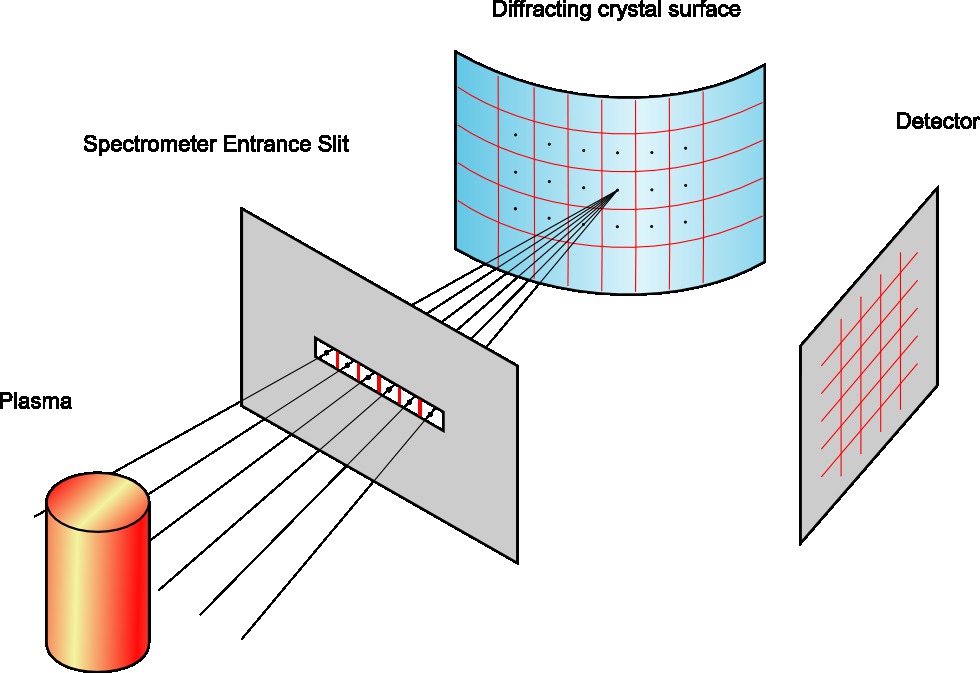
For the Crystal Spectrometer Imaging Model, a series of rays are projected from each pixel in the detector grid onto the surface of a curved crystal. The rays are reflected off the crystal surface then must pass through an aperture and intersect the plasma in order to contribute to the total intensity at the detector. For each detector pixel, the range of angles over which the rays hit the crystal surface determines the photon energy range detected (via. Bragg diffraction).
Controls for the crystal spectrometer calculation can be accessed from Detector settings by selecting Crystal spectrometer for the projection type. The following figure shows the crystal spectrometer user interface controls for an example calculation:
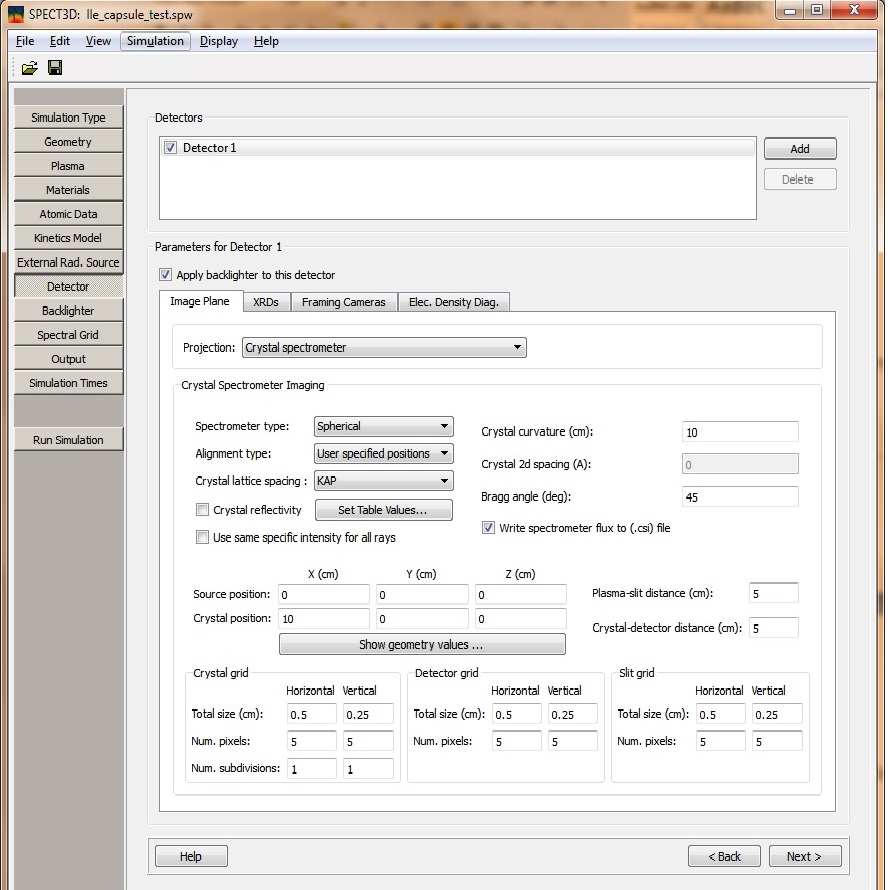
The top part of the widget contains
settings for the crystal properties, and geometry of the
spectrometer (Coordinate values are in the same frame of
reference as the source plasma) :
The lower part of the widget has a
several settings for controlling the number of divisions used
to divide the crystal, slit and detector surface. Each grid is
divided into a user specified number of horizontal and
vertical pixels. The number of horizontal pixels used for the
slit determines how well the angular width of the plasma
source is resolved by each crystal surface element. Since each
crystal surface element diffracts a range of photon energies,
the number of crystal surface points in the horizontal
direction determines how well the spectral distribution of the
source is resolved at the detector.
Some ‘rule of thumb’ guidelines to help choose grid values for crystal spectrometer settings can be given as follows:
During the detector calculation, each crystal surface element can be further sub-divided into a rectangular grid to effectively greatly increase the number of surface elements with minimal additional computational overhead. The angle resolved specific intensity is assumed to be uniform across each surface element, whilst the ray tracing calculation of the intensity contributions to the detector image is carried out using the sub-divided grid.
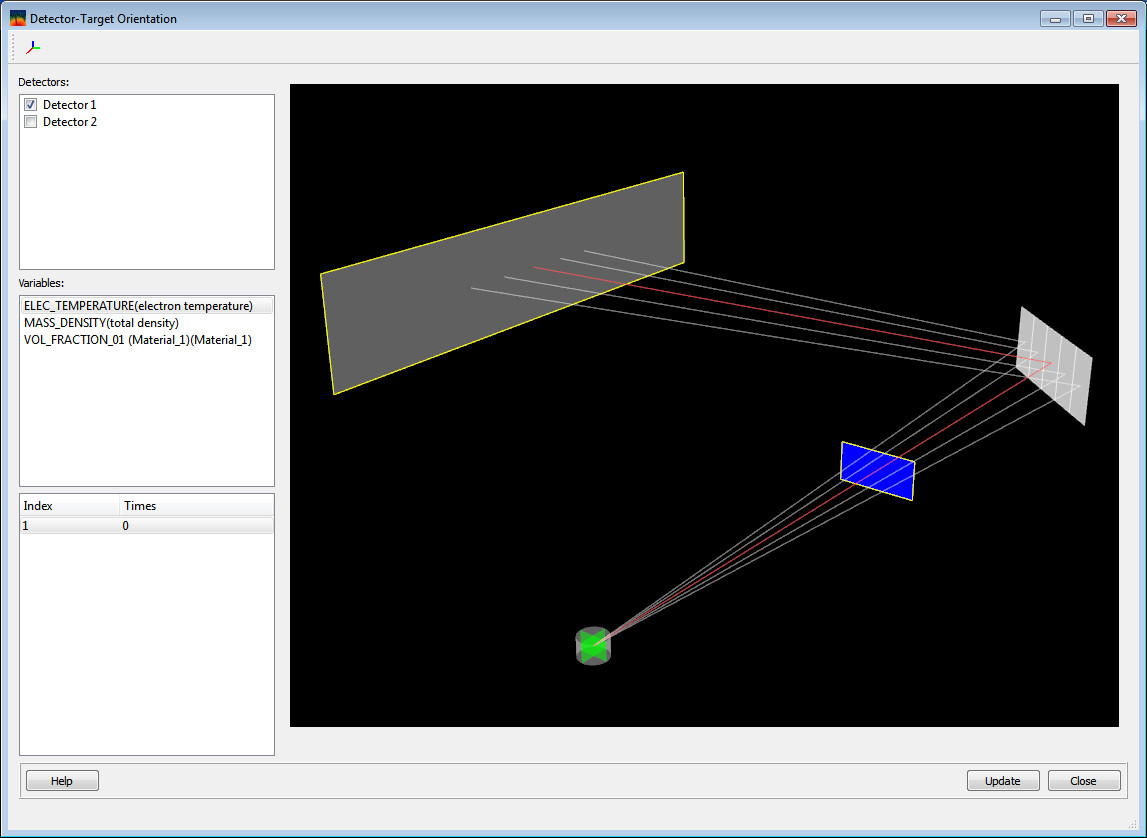
A 3-dimensional view of the crystal, slit, and
detector positions can be accessed via the Detector-Target
orientation tool from the Display menu.
The slit aperture is shown by a blue rectangle, the crystal by a
light gray surface and the detector by a dark gray rectangle -
see figure below. A series of white lines extending from the
spectrometer ‘source position’ coordinate to each point on the
crystal surface grid, and reflected off onto the detector plane
are also shown. These can be used as a guide to check whether
the sizes of the slit, crystal surface and detector are
appropriate for rays from the source to propagate to the
detector surface via the crystal. In addition to rotating and
zooming, the view can also be translated by clicking and
dragging with the middle mouse button (or scroll wheel).
| Copyright © 2024 Prism Computational Sciences, Inc. | SPECT3D 20.5.0 |