
Axes Settings
The axes settings can be changed on the Axis Properties dialog. To access the
dialog either:
- Select the menu item Axes | Properties from the menu bar or from the menus
shown on right-clicking on a graph.
- Click on the axes toolbar button:

- For 2D plots, double click on an axis.
On the 'Axis Settings' tab, the axis type, range,
position and visibility of the axis and axis components can all be set:
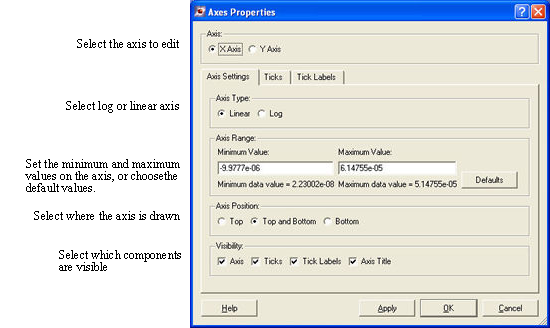
Notes:
- If the axis type is set to log and all the data is negative, the axis will
be linear.
- For a cascade, the minimum and
maximum values are the values used for each plot within the cascade. They
are not the same as the minimum and maximum values on the axis.
On the 'Ticks' tab, the tick spacing, the number
of minor ticks and the appearance of the ticks can be set:
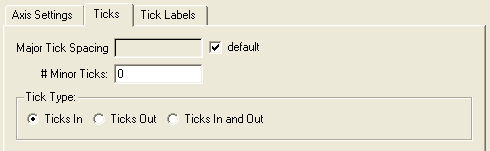
Notes:
- If the major tick spacing will give either an excessive number of ticks
or less than two ticks, the spacing value will be overridden.
- The maximum number of minor ticks is 9.
- For a log axis, the number of minor ticks is 8 and is not editable.
On the 'Tick Labels' tab the tick label font and
style can be set:
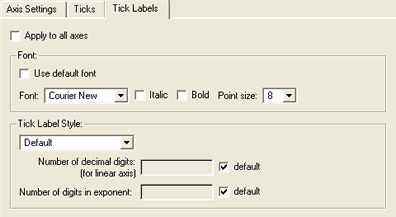
Notes:
- By checking the 'Apply to all axes' box, the font and tick label style can
be set the same for all the axes.
- The choices for the tick label style are:
- Default: the plot library will choose either decimal or scientific style,
depending on the data values.
- Decimal: e.g. 12345.678
- Scientific e.g. 1.2345e4
- Engineering e.g. 12.345e3 (the exponent will be in multiples of 3).
| Copyright © 2000-2026
Prism Computational Sciences, Inc. |
VISRAD 21.1.1 |