
3D Plots
Depending on the application, a 2D contour plot can be viewed as a 3D contour
plot by choosing the menu item View | 3D Contour. The 2D plot can be restored
by choosing View | 2D Contour.
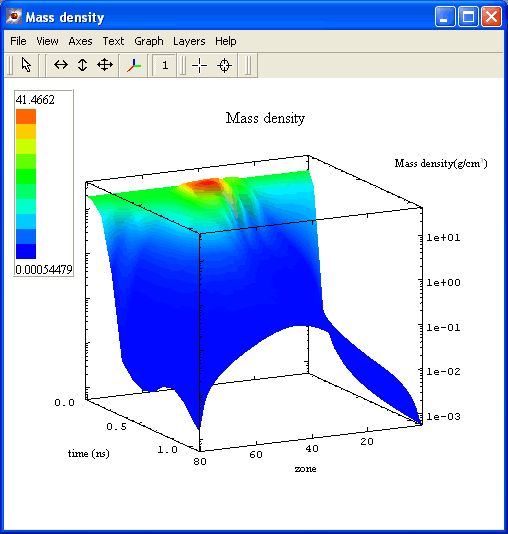
A 3D plot will generally be shown with a title, axes titles and a color bar.
In general, the properties can be edited by:
- Double clicking on the appropriate object.
- Via the context menu which will show following a right mouse click (see
menus).
- Via the tool buttons (see the graph
toolbar and the layer toolbar).
For specific features see:
3D Controls
- Return to original settings: Press the 'Esc' key
- Rotation:
- about x axis: hold down left mouse button and drag mouse in horizontal
direction.
- about y axis: hold down left mouse button and drag mouse in vertical
direction.
- about z axis: hold down left mouse button and 'Alt' key and drag mouse
in horizontal direction.
- Move: hold down 'm' key and move mouse in desired direction of movement.
- Zoom:
- use the vertical wheel on the mouse, if there is one.
- or, hold down the 'z' key and move the mouse up for increased zoom,
down for decreased.
- Stretch:
- in direction of x axis: hold down the 's' key and drag the mouse horizontally.
- in direction of y axis: hold down the 's' key and drag the mouse vertically.
- in direction of x axis: hold down the 's' key and the 'Alt' key and
drag the mouse horizontally.
- Eye movement: hold down the 'e' key and drag the mouse.
| Copyright © 2000-2026
Prism Computational Sciences, Inc. |
VISRAD 21.1.1 |