| CONTENTS | GLOSSARY | SUBJECT INDEX | SEARCH DOCUMENTATION |
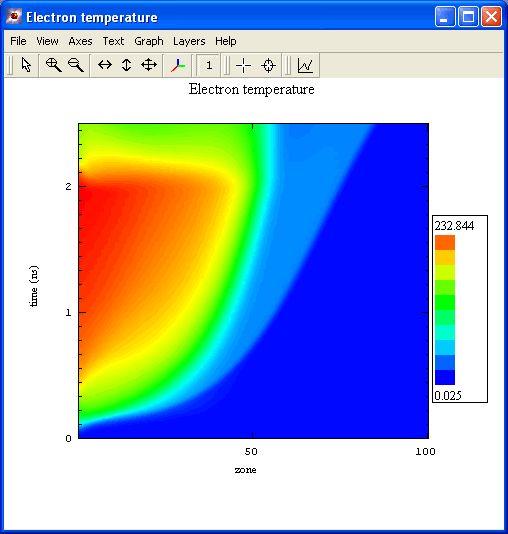
A contour plot will generally be shown with a title, axes titles and a color bar. In general, the properties can be edited by:
For specific features see:
Lineout plots can be displayed by clicking on the right most toolbar button.
| Copyright © 2000-2026 Prism Computational Sciences, Inc. | VISRAD 21.1.1 |