
| CONTENTS | GLOSSARY | SUBJECT INDEX | SEARCH DOCUMENTATION |
To view results , select Display | <result_type>.
By default, the color bar is set so that it bounds the minimum and maximum values of the quantity being displayed. The color bar limits can be set by selecting Set | Color Bar.
See example images for:
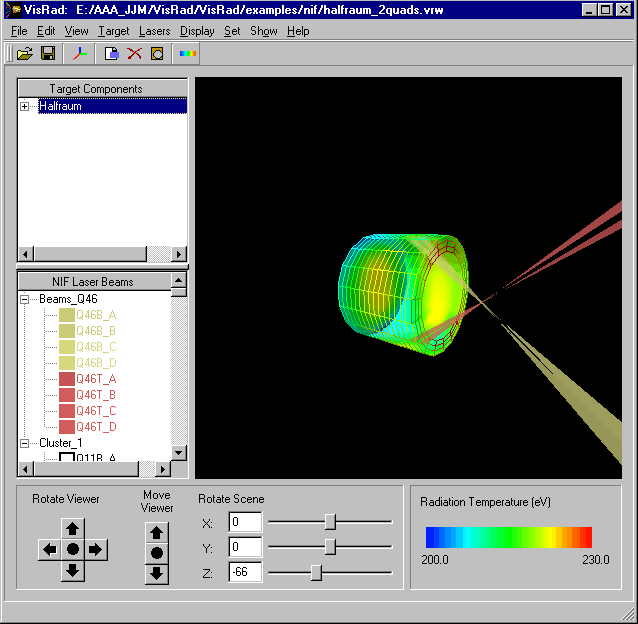
An image for the radiation temperature distribution is shown below.
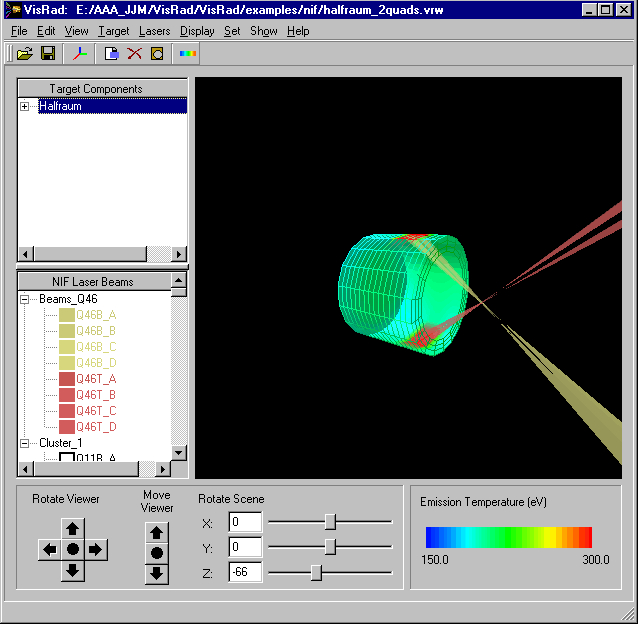
An image for the emission temperature distribution is shown below.
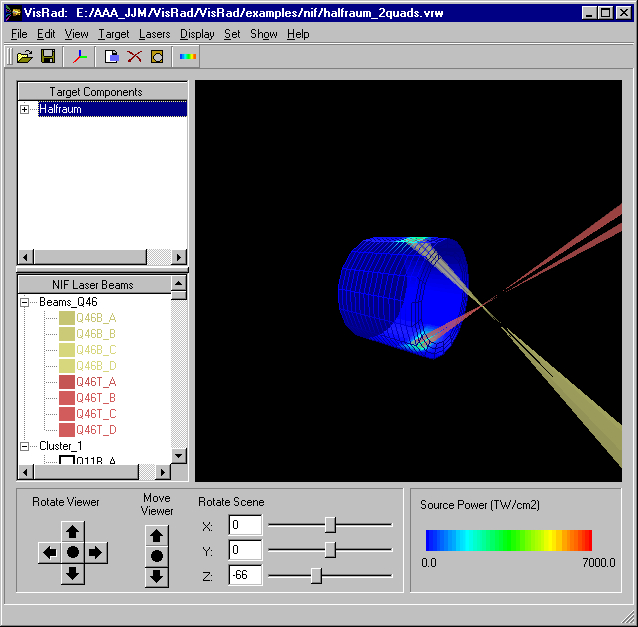
The source power due to the laser beams is shown below.
| Copyright © 2000-2026 Prism Computational Sciences, Inc. | VISRAD 21.1.1 |