
| CONTENTS | GLOSSARY | SUBJECT INDEX | SEARCH DOCUMENTATION |
To view results , select Display | <result_type>.
By default, the color bar is set so that it bounds the minimum and maximum values of the quantity being displayed. The color bar limits can be set by selecting Set | Color Bar.
See example images for:
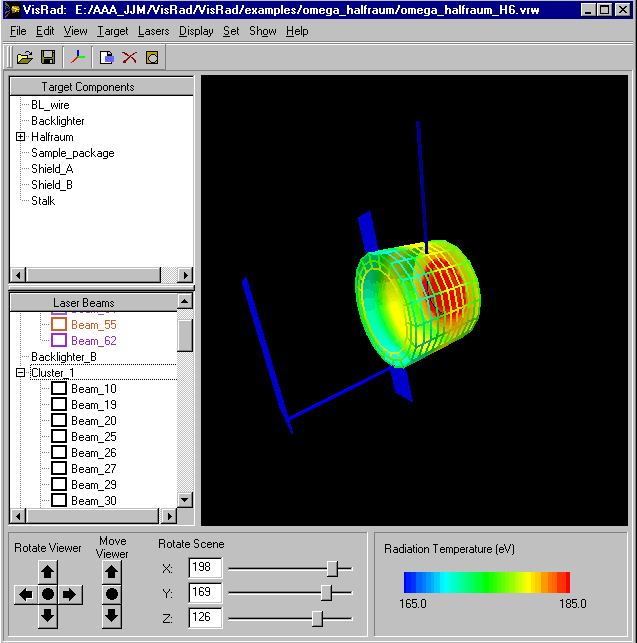
An image for the radiation temperature distribution is shown below.
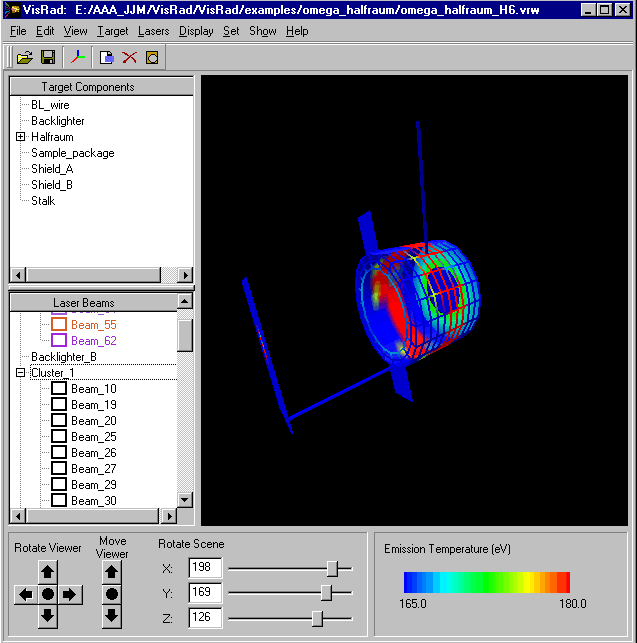
An image for the emission temperature distribution is shown below.
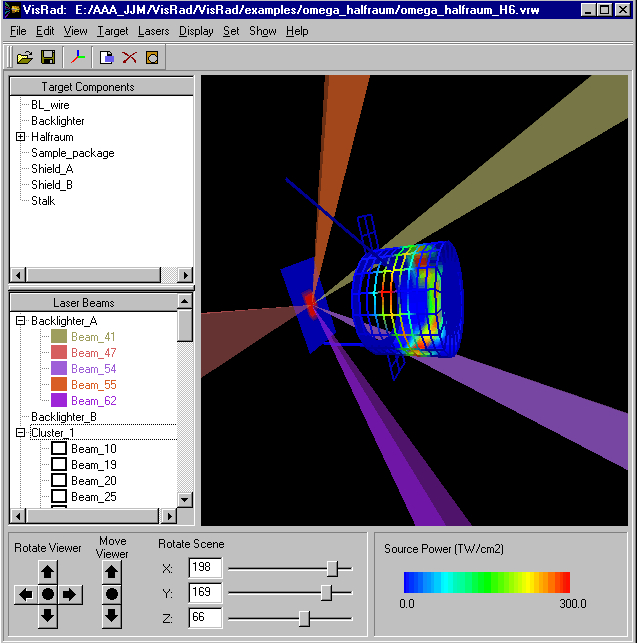
The source power due to the laser beams is shown below.
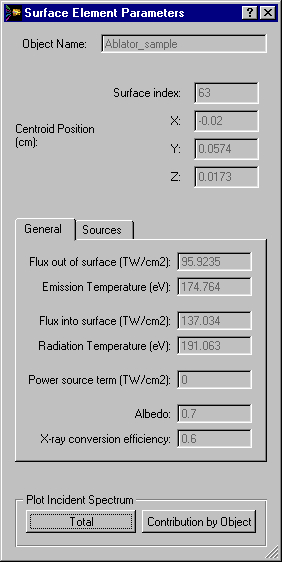
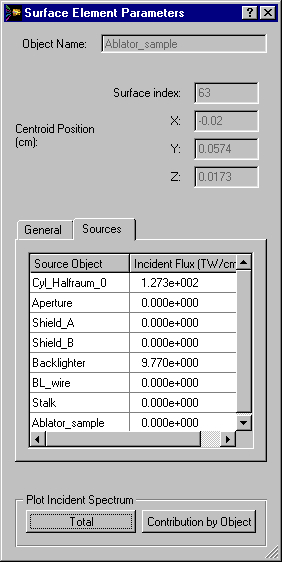
To view the properties of an individual surface element in the target grid, just double-click on the surface element. Below is an example for a surface element on the Sample Package. The Sources tab (shown on right) provides a breakdown of the contribution to the incident flux by object.
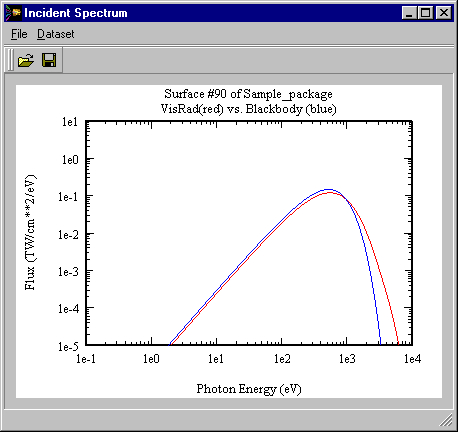
To view the incident spectrum for a surface element, press the "Show Incident Spectrum" button in the Surface Element Properties Dialog. Below is an example for a surface element on the Sample Package.
| Copyright © 2000-2026 Prism Computational Sciences, Inc. | VISRAD 21.1.1 |