
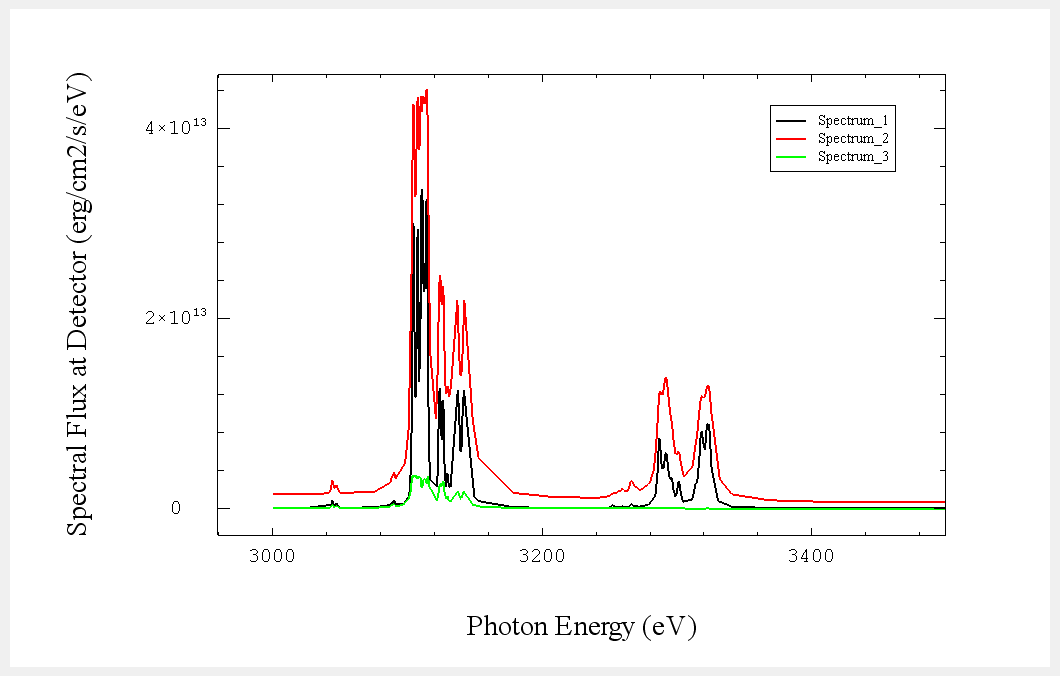
Line Plots
A line plot will generally be shown with a title, axes titles and a legend.
In general, the properties can be edited by:
- Double clicking on the appropriate object.
- Via the context menu which will show following a right mouse click (see
menus).
- Via the tool buttons (see the graph
toolbar and the layer toolbar).
- A limited set of editing features are available by right clicking on a line:
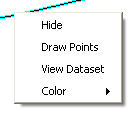
For specific features, see:
| Copyright
© 2000-2023 Prism Computational Sciences, Inc. |
PrismPLOT
|