| CONTENTS | GLOSSARY | SUBJECT INDEX | SEARCH DOCUMENTATION |


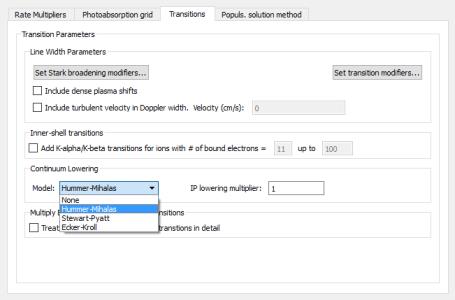
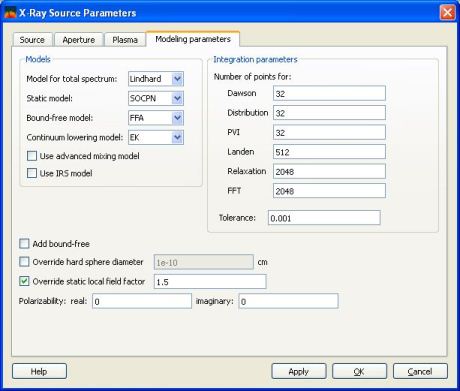
The check box for turning off the ionization potential energy shift due to continuum lower has been replaced by a multiplier. Setting the multiplier to zero turns off the energy shift.
For the Stewart-Pyatt and Ecker-Kroll models the multiplier is used in both computing the atomic level populations and the spectra. For the Hummer-Mihalas model, only the spectra are affected (as was the case previously).

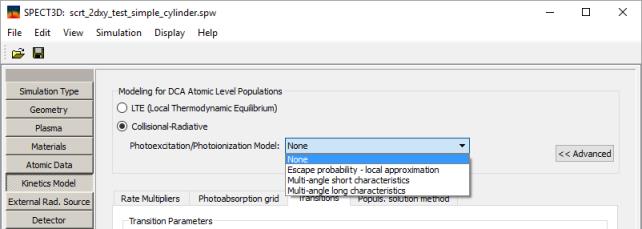
To modify transition parameters, users select one or more transitions from the upper table (see below), which contains a list of all available transitions. In the upper table, transitions can be filtered by: element, ionization stage, photon energy or wavelength, oscillator strength value (bound-bound transitions), and type of transition (bound-free, bound-bound, satellites, and/or virtual transitions can be excluded).
In the lower table, adjustments to transition energies and oscillator strengths can be made as follows:
The adjusted values are utilized both in computing photoexcitation/photoionization rates and resultant spectra.
Transition modifiers can also be imported/exported to data files so that they can be used in other SPECT3D or PrismSPECT applications. To do this, in the Set Transition Modifiers dialog, select the File | Import (Export) Transition Modifiers menu items.
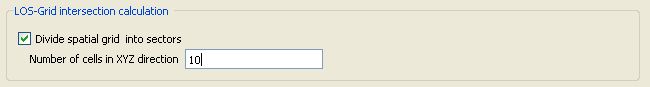
On test problems with ~ 70K volume elements, the CPU time required for grid-line of sight intersections had been reduced by a factor of 20 compared with the Individual Elements option for the LOS-Grid Intersection Model.
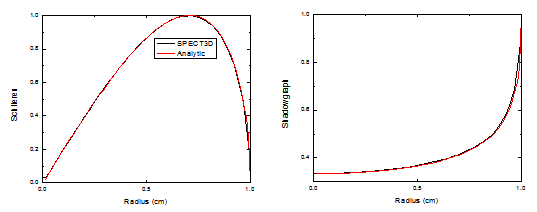
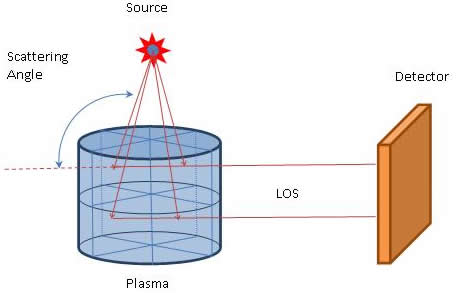
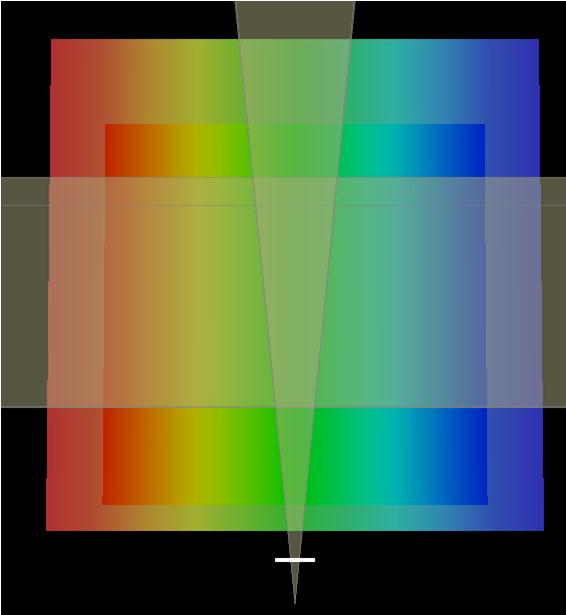
Schlieren and shadowgraphy images provide information on the spatial variation of the index of refraction across a probing laser beam. That is, they provide a measure of electron density gradients in the plasma by measuring their ability to deflect the probe laser light. The Schlieren image is a measure of the probe beam deflection angle. The shadowgraphy image is a measure of an intensity reduction factor. Each pixel in the two images is calculated by integrating along its line-of-sight.
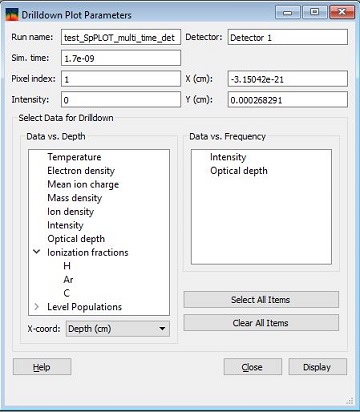
Images are computed based on the following. For each detector pixel i (i.e., line-of-sight through the plasma):


The index of refraction can be expressed in terms of electron number density Ne:
![]()
where Nc is the critical density.
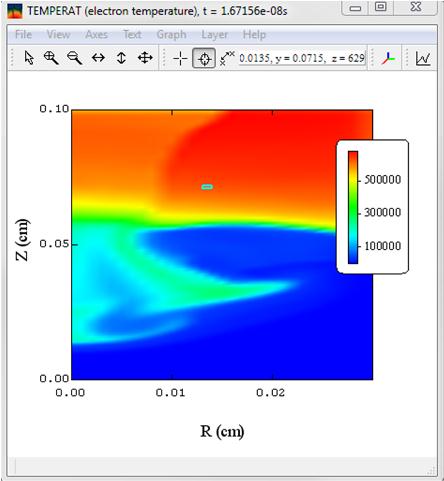
Figure below presents the results of SPECT3D simulations and their comparison against the analytic solutions. In the simulation, the temperature is sufficiently high to ensure that the plasma is completely ionized. The mass density of a plasma was chosen such that the logarithm of the index of refraction is a simple function of radius r and is not a function of an axial variable z:
![]()
In this case, the derivatives are simply:
![]()

![]()
![]()
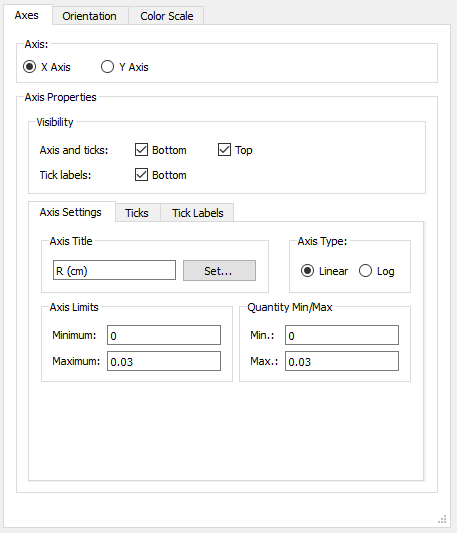
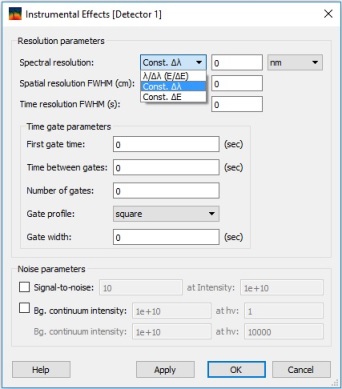
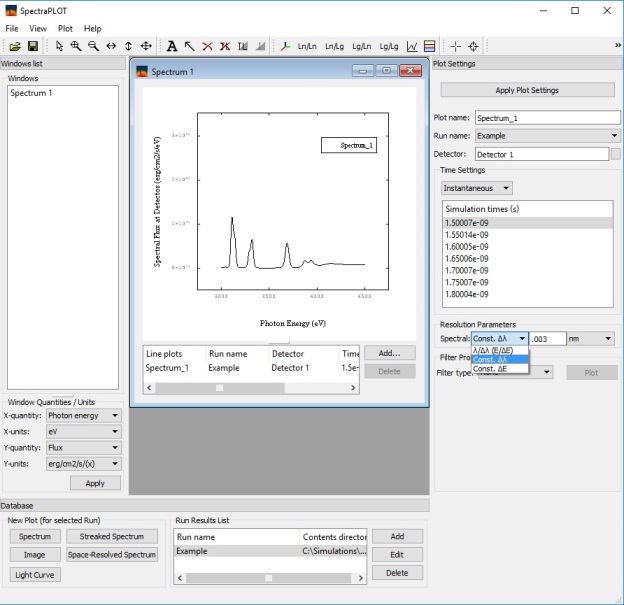
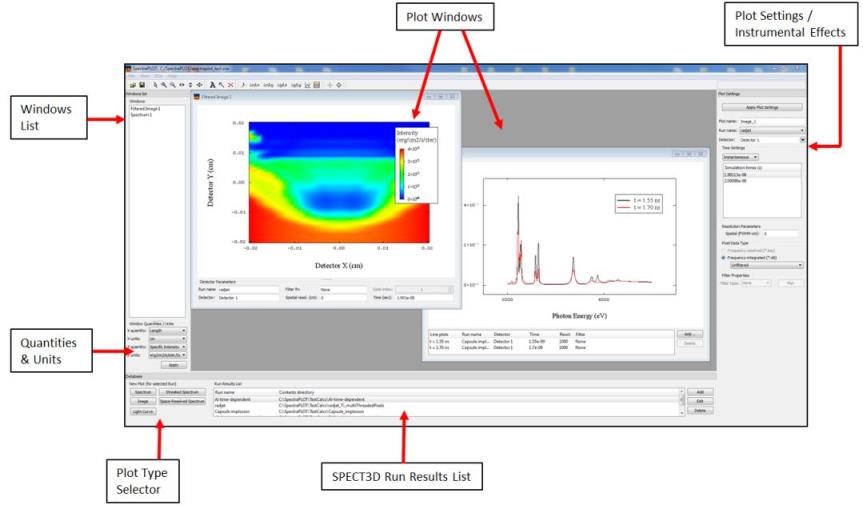
SpectraPLOT features a user-friendly graphical interface for viewing a wide variety of results from SPECT3D simulations, and applying various instrumental effects to the simulated images and spectra, such as time integration, spectral resolution, and spatial resolution. It has been designed to run on multiple platforms (Windows, Linux, Mac).
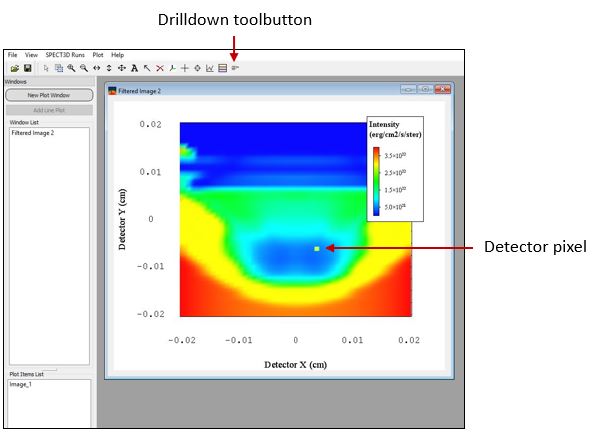
SpectraPLOT is a Multiple Document Interface (MDI) application, and allows for displaying results from multiple SPECT3D runs. An image of the SpectraPLOT main window is below:


.
.


.
![]()
| Copyright © 2024 Prism Computational Sciences, Inc. | SPECT3D 20.5.0 |