
| CONTENTS | GLOSSARY | SUBJECT INDEX | SEARCH DOCUMENTATION |
Below, we examine the power source distribution in the 3ω plane due to the 4 beams of quad Q15T.
To view power source results, select Display | Power Source.
By default, the color bar is set so that it bounds the minimum and maximum values of the quantity being displayed. The color bar limits can be set by selecting Set | Color Bar.
By default, VISRAD computes the source power due to all 3 (blue, green, and red) cones of NIF laser beams, and only the blue cone is displayed in the graphics window. To adjust the visibility of blue, green, and red cones, or turn the power source on/off, use the NIF Beam Parameters dialog.
Below, example images are shown for:
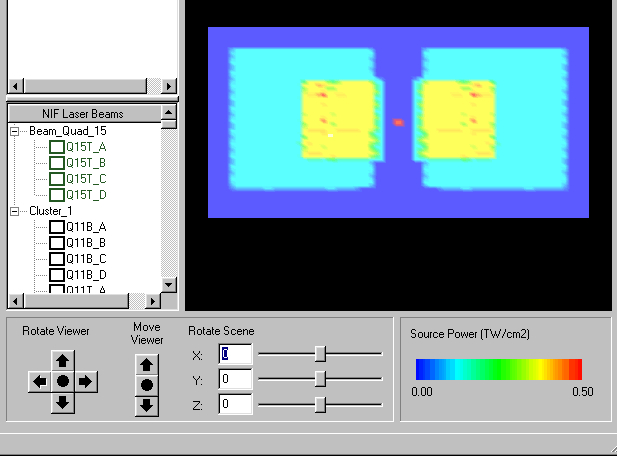
The source power due to the blue (3ω), green (2ω), and red (1ω) cones is shown below. The small red pixel at the center of the rectangle is due to the blue laser light. The predominantly yellow portion is due to green laser light, while the predominantly cyan portion is due to red laser light.
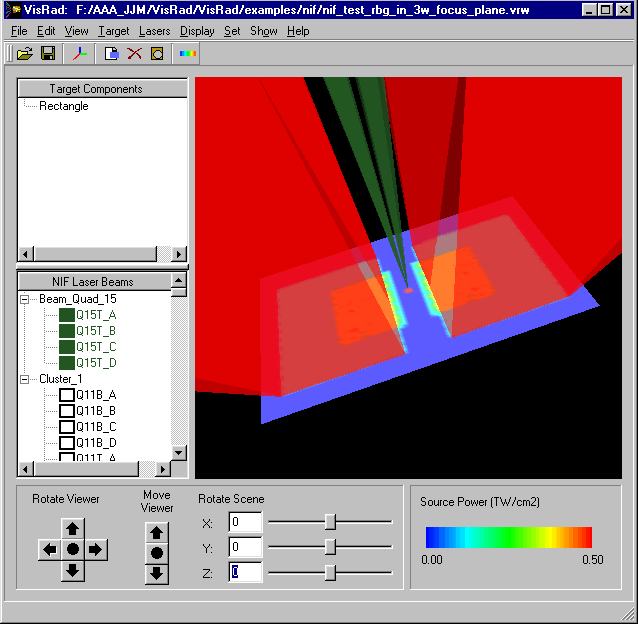
An image for the power source distribution with the red and blue cones superimposed is shown below (view from Port 7 - 240). Note that red (1ω) cones are always displayed as red, while blue (3ω) cones are displayed by a wide range of colors. The blue cones for the Q15T quad are shown in olive.
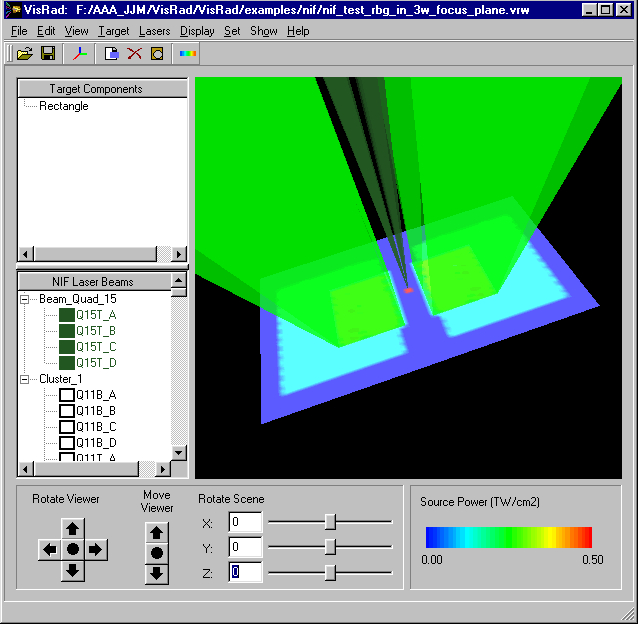
An image for the power source distribution with the Green and Blue cones superimposed is shown below (view from Port 7 - 240). Note that Green (2ω) cones are always displayed as green, while Blue (3ω) cones are displayed by a wide range of colors. The blue cones for the Q15T quad are shown in olive.
| Copyright © 2000-2026 Prism Computational Sciences, Inc. | VISRAD 21.1.1 |