
| CONTENTS | GLOSSARY | SUBJECT INDEX | SEARCH DOCUMENTATION |
The Viewing Positions and Color Bar Frame resides at the lower right corner of the Main Window.
Toggling between showing the Viewing Position values and the Color Bar Panel is controlled by right-clicking on that area of the Main Window.
When displaying data (using the Display menu), the Color Bar Panel is automatically displayed for all quantities other than Grid (in which case the Viewing Position values are shown).
The Viewing Position is updated at the view is changed due to rotations, zooming, and translations. The position is relative to target chamber center (TCC), and can be shown in Cartesian, cylindrical, or spherical geometries.
The (![]() ) button to the right displays the Coordinate Transformation Tool so that the position can easily be found in any reference coordinate system.
) button to the right displays the Coordinate Transformation Tool so that the position can easily be found in any reference coordinate system.
When the Color Bar Frame is displayed, the title identifies the quantity being displayed and its units.
To set the limits for the color bar, either choose the menu item Set | Color Bar, click the Set Color Bar button on the toolbar, or double-click on the color bar.
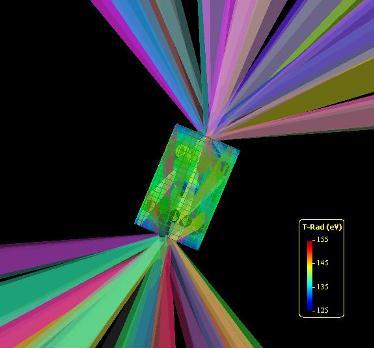
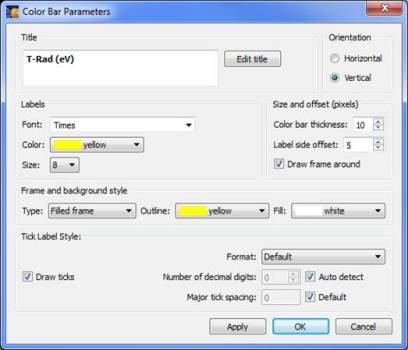
In addition, a color bar can be shown as an overlay in the Main Graphics Window (as shown in the left image below). To display the color bar, select the Show | Color Bar Overlay menu item. By double-clicking on the color bar box, the properties of the color bar can be edited (using the dialog shown on right in image below).
Note that the color bar limits, color map, and specification of linear vs. log plotting are still specified in the Color Bar Settings dialog (displayed with the Set | Color Bar menu item or double-clicking on the color bar located below the Main Graphics Window).
| Copyright © 2000-2026 Prism Computational Sciences, Inc. | VISRAD 21.1.1 |