
| CONTENTS | GLOSSARY | SUBJECT INDEX | SEARCH DOCUMENTATION |
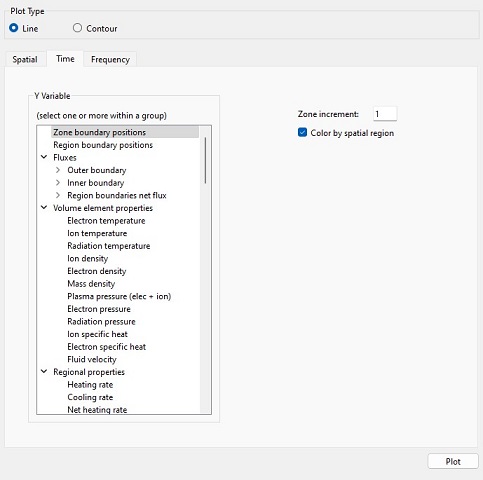
Time-dependent line plots are controlled in Time tab widget.
The list of available quantities to plot is shown in the box on the left. Depending on which quantity is selected, additional input is specified on the right.
For additional information on plotting time-dependent quanties, see:
After a selection has been made, click on the Plot button or press the Enter key.
| Copyright © 2002-2025 Prism Computational Sciences, Inc. | HELIOS 11.0.0 |