
3D Plots
Depending on the application, a 2D contour plot can be viewed as a 3D contour
plot by choosing the menu item View | 3D Contour. The 2D plot can be restored
by choosing View | 2D Contour.
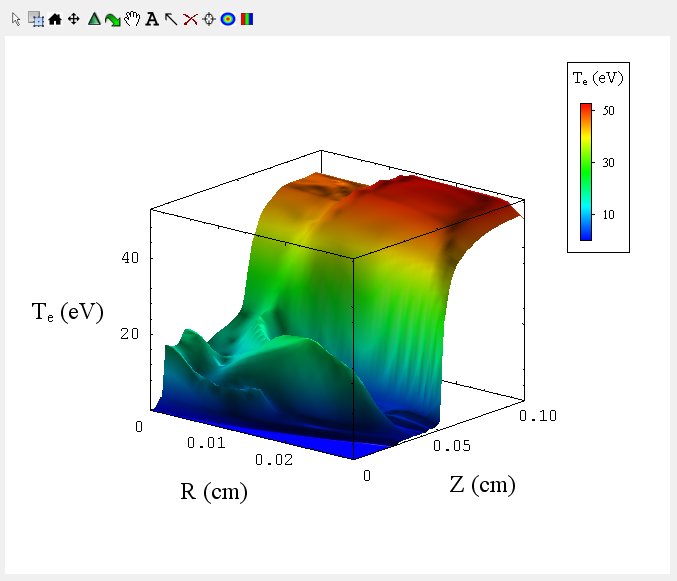
A 3D plot will generally be shown with a title, axes titles and a color bar.
In general, the properties can be edited by:
- Double clicking on the appropriate object.
- Via the context menu which will show following a right mouse click (see
menus).
- Via the tool buttons (see the graph
toolbar and the layer toolbar).
For specific features see:
3D Controls
- Reset Plot
 :
:
- use "Reset View" toolbar item to reset the 3D plot's initial position and orientation as well as it's axis titles and colorbar.
- use "Rescale Axes" toolbar item to reset axes limits.
- Manipulate Plot
 :
:
- use the mouse wheel to zoom in and out.
- use the "Mouse Zoom" toolbar item to drag mouse and zoom in/out.
- rotate about x axis with "Rotate" toolbar item: hold down left mouse button and drag mouse in vertical direction.
- rotate about z axis with "Rotate" toolbar item: hold down left mouse button and drag mouse in horizontal direction.
- use "Translate" toolbar item to move plot vertically or horizontally
- Set Eye-Scene view:

- Revert to 2D
 :
:
- use "Show as contour plot" to revert 3D plot back to 2D plot
General Notes
-
The widget type of a 3D plot is relevant to how all plots within that widget behave. For instance, isosurface plot widgets always have symmetric plots limits (same min-max on all axes), but 3D contour plot widgets do not have this constraint. If a 3D contour plot is dropped into an isosurface plot widget, and that plot widget is then rescaled, all the axis will reset based on the largest value present in any plot in that widget. This will not happen with dropping an isosurface plot into a 3D contour plot widget.
| Copyright
© 2000-2023 Prism Computational Sciences, Inc. |
PrismPLOT
|