
| CONTENTS | GLOSSARY | SUBJECT INDEX | SEARCH DOCUMENTATION |
To view results , select Display | <result_type>.
By default, the color bar is set so that it bounds the minimum and maximum values of the quantity being displayed. The color bar limits can be set by selecting Set | Color Bar.
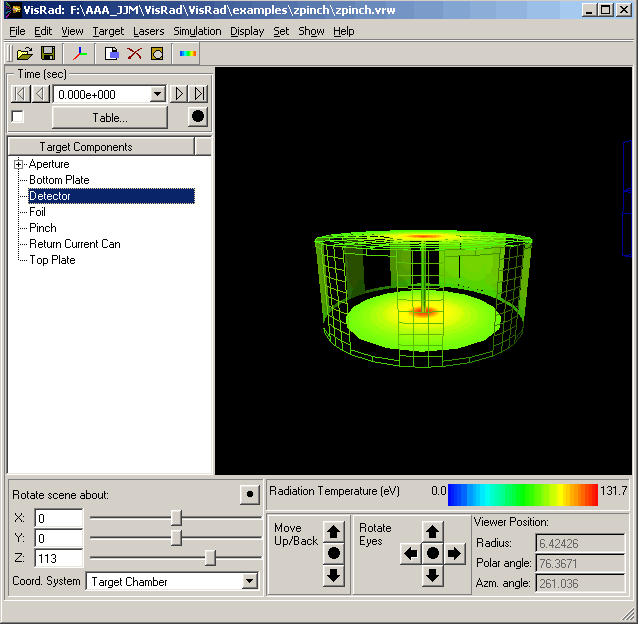
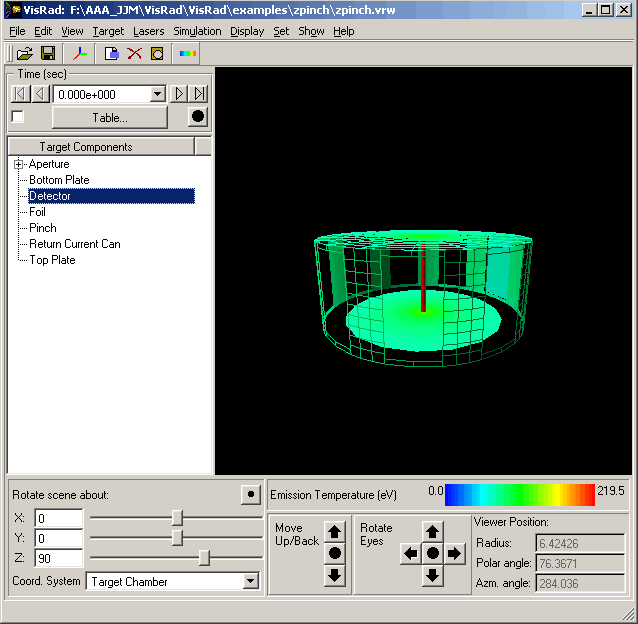
Results for the radiation temperature and emission temperature in this example are shown below.
Results for an individual surface element in the target grid can be displayed by "picking" it (double-clicking on it) with the mouse. For example, to view the flux at the detector, double-click on a surface element on the detector in the graphics frame.
Because the detector is located far from the target chamber center in this example, it is sometimes easier to locate target components in the grid by setting the viewing position.
In some problems, it is desirable to see what portions of the target grid a particular surface element sees. In the example below, the transmission fractions are shown for a surface element on the detector. The view is through the aperture. The red parts of the grid are the surface elements that are seen by the detector.
![]()
| Copyright © 2000-2026 Prism Computational Sciences, Inc. | VISRAD 21.1.1 |